Key words
Tilia platyphyllos
-
Tilia cordata
- Malvaceae - Tiliae flos - alkaloid - dihydropyrrole - piperidine
Introduction
According to the European Pharmacopoeia, lime flower (Tiliae flos) is an herbal material
consisting of the dried inflorescences including the floral bracts of Tilia cordata MILL. (small-leaved lime), Tilia platyphyllos SCOP. (large-leaved lime), Tilia × vulgaris HEYNE (hybrid of both), or their mixtures. The genus Tilia belongs to the plant family of Malvaceae. The European Medicinal Agency has registered
the medical use of lime flower as a traditional herbal medicinal product for the relief
of symptoms of common cold and mental stress [1], [2], [3]. The quality of lime flower for medical use is specified in the respective monograph
of the European Pharmacopoeia [3].
From the phytochemical point of view, the herbal material is characterized by the
presence of about 1% of a complex mixture of flavonoids, mainly glycosides of quercetin
(e.g., rutin, hyperosid, quercitrin, isoquercitrin, quercetin-3,7-di-O-rhamnoside, quercetin-rhamno-xyloside, quercetin-3-O-gluco-7-O-rhamnoside) and kaempferol glycosides (e.g., astragalin, tilirosid, kaempferol-3-O-gluco-7-O-rhamnoside, kaempferol-3,7-di-O-rhamnoside) [4], [5], [6]. Polysaccharides (about 10%) are mainly composed of acidic arabinogalactans [7]. Volatile oil (0.02 to 0.1%) consists mainly of monoterpenes (linalool, geraniol,
1,8-cineol, carvone, camphor, thymol, carvacrol), phenylpropanoids (anethol, eugenol),
benzyl alcohol, 2-phenylethanol, and the respective acetic acid and benzoic acid esters
[8]. The
herbal material contains a high content of oligomeric and polymeric proanthocyanidins,
mainly composed of catechin and epicatechin building blocks [9]. Furthermore, organic acids (e.g., caffeic acid, p-coumaric acid, and esters), coumarins (e.g., scopoletin, fraxin-8-β-D-glucoside), amino acids, carbohydrates, saponins, and tocopherol have been described
[1], [2].
The traditional use of lime flower preparations has not been rationalized sufficiently.
Polysaccharides from lime flower are known to form strong bioadhesive layers on buccal
epithelia, leading to rehydration and shielding of infected epithelia. These bioadhesive
and mucilaginous properties could potentially explain a reduction of cough intensity
and the traditional use of the herbal material for common cold [10]. Central effects of the volatile oil have been discussed to be responsible for sedation
and reduced motility [11]. Increased perspiration by the herbal material as part of the treatment of fever
in patients suffering from a common cold has not been proven until now. It also has
not been linked to any natural products of the herbal material. Surprisingly, a detailed
phytochemical reinvestigation of the herbal material by our group revealed the presence
of alkaloids in hydroacetonic and hydroalcoholic extracts
from lime flower. The present contribution reports on the structural characterization
of so far undescribed glycosylated piperidine and 3,4-dihydro-2H-pyrrole alkaloids. Although alkaloids are known for the Malvaceae plant family [12], [13], [14], this is the first report on alkaloids from the genus Tilia.
Results and Discussion
Lime flower herbal material was extracted with acetone/water (7 : 3 v/v) according to a protocol typically used for extracting polar and semi-polar constituents
from plant material [9]. The detailed extraction and separation scheme, as well as the respective yields,
are shown in [Fig. 1].
 Fig. 1 Fractionation scheme of dried lime flowers towards the isolation of 3,4-dihydro-2H-pyrrole alkaloids 1a and 1b, piperidine alkaloids 2a and 2b, and acetylated piperidine alkaloids 3a and 3b.
Analysis of the obtained extract A by reversed-phase HPLC coupled with (+)-ESI-qTOF-MS
showed 6 major peaks (m/z 510, 512, and 554) and 1 minor peak (m/z 552) in the base peak chromatogram (Fig. 1S, Supporting Information). Even-numbered m/z values were indicative for compounds with an odd number of nitrogen atoms. In-depth
literature search on nitrogenous natural products from the genus Tilia did not reveal any information on such compounds in the respective mass range. To
clarify the identity of these compounds, the extract A was further fractionated by
solid phase extraction (SPE) using a strong cationic exchanger. This protocol yielded
4 different fractions (acidic fraction, neutral fraction, basic fraction, and wash
eluate). The sought nitrogenous compounds were exclusively detected in the basic fraction
B, which was eluted with 5% NH3 in methanol/acetonitrile (1 : 1 v/v). LC-HR-MS analysis of this fraction
additionally indicated the presence of a variety of amino acids. Fraction B was
further fractionated on a Sephadex LH-20 column. This procedure yielded a fraction
C, which consisted of the desired compounds, while all amino acids had been removed.
Fraction C was finally subjected to preparative RP18-HPLC, which resulted in the isolation
of 6 substances (1a/1b, 2a/2b, 3a/3b), consisting of 3 pairs of isobaric compounds, according to LC-HR-MS analysis. Structure
elucidation by 1D- and 2D-NMR and LC-ESI-qTOF-HR-MS revealed previously undescribed
natural products, which were named as follows: tiliine A (1a) and tiliine B (1b), tiliamine A (2a) and tiliamine B (2b), and tilacetine A (3a) and tilacetine B (3b) ([Fig. 2]).
 Fig. 2 Structures of 3,4-dihydro-2H-pyrrole alkaloids (1), piperidine alkaloids (2), and 3-O-acetylated piperidine alkaloids (3) from lime flower. As absolute stereochemistry at the N-containing heterocycle has
not been determined, both substituents at C-2/C-3 for 1a and 1b resp. for C-2/C-3 for compounds 2a and 2b and 3a and 3b are cis-orientated and the existence of 2 diastereomers is obvious, but it cannot
unambiguously notated which compound refers to which absolute stereochemistry. 1a/1b: tiliine A/B, 2a/2b: tiliamine A/B, 3a/3b: tilacetine A/B.
Fig. 2 Structures of 3,4-dihydro-2H-pyrrole alkaloids (1), piperidine alkaloids (2), and 3-O-acetylated piperidine alkaloids (3) from lime flower. As absolute stereochemistry at the N-containing heterocycle has
not been determined, both substituents at C-2/C-3 for 1a and 1b resp. for C-2/C-3 for compounds 2a and 2b and 3a and 3b are cis-orientated and the existence of 2 diastereomers is obvious, but it cannot
unambiguously notated which compound refers to which absolute stereochemistry. 1a/1b: tiliine A/B, 2a/2b: tiliamine A/B, 3a/3b: tilacetine A/B.
Compound 1a was isolated as a yellow oil from fraction C. Detailed 1H, 13C, COSY, and NOESY NMR data of 1a are displayed in [Table 1]. HR-MS analysis showed a quasi-molecular ion at m/z 510.3081 [M + H]+, correlating to the molecular formula [C27H44NO8]+. MS2 analysis at a collision energy of 70 eV showed a fragment with m/z 348.2491 [C21H34NO3]+ and a neutral loss of 162.0481 amu (C6H10O5), indicating the presence of a hexose moiety (Fig. 2S, Supporting Information). This was also proven by carbohydrate-typical resonances
in the respective NMR spectra (C-1‴ to C-6‴, see [Table 1]). The UV spectrum showed a maximum of absorption at λ
max 285 nm, indicating the presence of a phenolic group
(Fig. 3aS, Supporting Information).
Table 1 1H, 13C, COSY, and NOESY spectroscopic data for compounds 1a and 1b.
|
1a
|
1b
|
|
Position
|
δ
C [ppm]
|
δ
H [ppm] (mult., J/Hz, No. H)
|
COSY
|
NOESY
|
δ
C [ppm]
|
δ
H [ppm] (mult., J/Hz, No. H)
|
COSY
|
NOESY
|
|
2
|
57.2
|
3.86 (m, 1H)
|
H-3, H-6
|
H-3, H-4a, H-6
|
59.1
|
3.73 (m, 1H)
|
H-3, H-6
|
H-3, H-4a, H-6
|
|
3
|
64.1
|
4.04 (dt, J = 4.8, 2.4 Hz, 1H)
|
H-2, H-4a/b
|
H-2, H-4a/b, H-6
|
66.4
|
3.89 (m, 1H)
|
H-2, H-4a/b
|
H-2, H-4a/b, H-6
|
|
4a
|
25.4
|
1.92 (m, 1H)
|
H-3, H-4b
|
H-2, H-3, H-4b
|
22.5
|
1.96 (dd, J = 14.1, 2.6 Hz, 1H)
|
H-3, H-4b
|
H-2, H-3, H-4b
|
|
4b
|
|
2.02 (dd, J = 14.0, 4.2 Hz, 1H)
|
H-3, H-4a
|
H-3, H-4b
|
|
1.88 (dd, J = 14.1, 6.2 Hz, 1H)
|
H-3, H-4a
|
H-3, H-4b
|
|
5
|
195.1
|
–
|
–
|
–
|
193.0
|
–
|
–
|
–
|
|
6
|
15.3
|
1.42 (d, J = 7.0 Hz, 3H)
|
H-2
|
H-2, H-3
|
15.3
|
1.43 (d, J = 7.0 Hz, 3H)
|
H-2
|
H-2, H-3
|
|
1′
|
38.8
|
2.67 (m, 2H)
|
H-2′
|
H-2′, H-3′–8′
|
39.0
|
2.67 (m, 2H)
|
H-2′
|
H-2′, H-3′–8′
|
|
2′
|
27.6
|
1.70 (m, 2H)
|
H-1′, H-3′
|
H-1′, H-3′–8′
|
27.2
|
1.69 (q, J = 7.3 Hz, 2H)
|
H-1′, H-3′
|
H-1′, H-3′–8′
|
|
3′–8′
|
30.01 – 30.4
|
1.35 – 1.29 (m, 12H)
|
H-2′, H-9′
|
H-2′, H-9′, H-10′a/b, H-3″
|
30.0 – 30.4
|
1.35 – 1.29 (m, 12H)
|
H-2′, H-9′
|
H-2′, H-9′, H-10′a/b, H-3″
|
|
9′
|
31.2
|
1.59 (t, J = 7.3 Hz, 2H)
|
H-8′, H-10′a/b
|
H-2′, H-10′a/b, H-3″
|
31.2
|
1.59 (t, J = 7.3 Hz, 2H)
|
H-8′, H-10′a/b
|
H-2′, H-10′a/b, H-3″
|
|
10′a
|
31.0
|
2.58 (dt, J = 13.5, 7.6 Hz, 1H)
|
H-9′, H-10′b
|
H-9′, H-10b, H-3″
|
31.0
|
2.59 (dt, J = 13.3, 7.6 Hz, 1H)
|
H-9′, H-10′b
|
H-9′, H-10b, H-3″
|
|
10′b
|
|
2.68 (m, 1H)
|
H-9′, H-10′a
|
H-9′, H-10a, H-3″
|
|
2.68 (m, 1H)
|
H-9′, H-10′a
|
H-9′, H-10a, H-3″
|
|
1″
|
150.3
|
–
|
–
|
–
|
150.3
|
–
|
–
|
–
|
|
2″
|
135.1
|
–
|
–
|
–
|
135.1
|
–
|
–
|
–
|
|
3″
|
117.4
|
6.57 (d, J = 3.0 Hz, 1H)
|
H-5″
|
H-3′–8′, H-9′, H-10′a/b
|
117.4
|
6.57 (d, J = 2.9 Hz, 1H)
|
H-5″
|
H-3′–8′, H-9′, H-10′a/b
|
|
4″
|
153.5
|
–
|
–
|
–
|
153.5
|
–
|
–
|
–
|
|
5″
|
113.8
|
6.54 (dd, J = 8.6, 3.0 Hz, 1H)
|
H-6″
|
H-6″
|
113.8
|
6.55 (dd, J = 8.6, 3.0 Hz, 1H)
|
H-6″
|
H-6″
|
|
6″
|
118.5
|
7.01 (d, J = 8.7 Hz, 1H)
|
H-5″
|
H-5″, H-1‴
|
118.5
|
7.01 (d, J = 8.7 Hz, 1H)
|
H-5″
|
H-5″, H-1‴
|
|
1‴
|
104.0
|
4.72 (d, J = 7.8 Hz, 1H)
|
H-2‴
|
H-6″, H-2‴–5‴
|
104.0
|
4.72 (d, J = 7.6 Hz, 1H)
|
H-2‴
|
H-6″, H-2‴–5‴
|
|
2‴
|
75.2
|
3.43 (m, 1H)
|
H-1‴
|
H-1‴
|
75.2
|
3.43 (m, 1H)
|
H-1‴
|
H-1‴
|
|
3‴
|
78.4
|
3.43 (m, 1H)
|
H-4‴
|
H-1‴
|
78.4
|
3.43 (m, 1H)
|
H-4‴
|
H-1‴
|
|
4‴
|
71.5
|
3.37 (m, 1H),
|
H-3‴
|
H-1‴, H-6‴a/b
|
71.5
|
3.38 (m, 1H)
|
H-3‴
|
H-1‴, H-6‴a/b
|
|
5‴
|
78.0
|
3.37 (m, 1H),
|
H-6‴
|
H-1‴, H-6‴a/b
|
78.0
|
3.38 (m, 1H)
|
H-6‴
|
H-1‴, H-6‴a/b
|
|
6‴a
|
62.6
|
3.70 (dd, J = 12.0, 5.1 Hz, 1H)
|
H-5‴, H-6‴b
|
H-6‴b
|
62.6
|
3.71 (m, 1H)
|
H-5‴, H-6‴b
|
H-6‴b
|
|
6‴b
|
|
3.88 (dd, J = 12.0, 2.1 Hz, 1H)
|
H-5‴, H-6‴a
|
H-6‴a
|
|
3.88 (m, 1H)
|
H-5‴, H-6‴a
|
H-6‴a
|
13C NMR signals ([Table 1]) at δ
C 153.5 (C-4″), 150.3 (C-1″), 135.1 (C-2″), 118.5 (C-6″), 117.4 (C-3″), and 113.84
(C-5″) ppm indicated the presence of an aromatic system, in which 2 positions were
linked to an oxygen (C-1″, C-4″) and 1 position was substituted by an additional carbon
(C-2″). Para-substitution was deduced from the 1H NMR signals at δ
H 7.01 ppm (H-6″), δ
H 6.57 ppm (H-3″), and δ
H 6.54 ppm (H-5″) and was additionally confirmed by the typical roof effect of the
signals from H-5″ and H-6″ ([Table 1]; Fig. 6aS, Supporting Information).
Interestingly, a carbon (C-5) with a strong downfield shift (δ
C 195.08 ppm) was observed, which was assumed to be connected to a nitrogen atom via
double bond linkage. HMBC data ([Fig. 3]; Fig. 6eS, Supporting Information) showed a correlation between the protons H-2, H-4a/b, and
H-3 with C-5. Together with the respective COSY NMR data ([Table 1]) a 3,4-dihydro-2H-pyrrole structure was proposed. Additionally, substitution of the heterocycle by
a methyl group was deduced, based on COSY correlations from H-2 to the protons of
a methyl group at δ
H 1.42 ppm (H-6). Substitution of C-3 with a hydroxyl group was proposed on the basis
of the typical downfield shift of C-3 at δ
C 64.0 ppm. Furthermore, HMBC data showed that an alkyl chain of 10 carbons (C-1′–C-10′),
was linked to C-5 via C-1′. This alkyl chain connects the heterocycle with the phenolic
part of
the molecule, which was proven by HMBC correlations of the protons from carbon
C-10′ with the aromatic carbons ([Fig. 3]; Fig. 6eS, Supporting Information).
 Fig. 3 Key HMBC correlations for the 3 Tilia alkaloid classes, which are detectable for each of the respective stereoisomer. The
arrows represent the correlations of a proton with the respective carbon.
Fig. 3 Key HMBC correlations for the 3 Tilia alkaloid classes, which are detectable for each of the respective stereoisomer. The
arrows represent the correlations of a proton with the respective carbon.
Further analysis of the MS2 fragmentation pattern confirmed the proposed structural features. The different parts
of the molecule (hexose, dihydroxy-methyl-phenol, alkyl chain, and methyl-hydroxy-disubstituted
dihydropyrrole) were verified by the MS fragmentation pattern ([Fig. 4]): after elimination of a hexose moiety, a neutral loss of 124.0519 amu was observed,
indicative of a methyl-hydroquinone structure, as proposed by NMR analysis. The resulting
fragment (m/z 224.2011, [C14H26NO]+) was in accordance with a methyl-hydroxy-disubstituted dihydropyrrole moiety linked
to a 9-carbon alkyl chain. A series of neutral losses of 14.0166 amu (CH2) was observable starting from m/z 224.2011 and ending with the heterocyclic ring at m/z 112.0756 [C6H10NO]+. This confirms the proposed alkyl chain connected to a
2-methyl-3,4-dihydro-2H-pyrrol-3-ol moiety. Additionally, the elimination of the hydroxyl group in position
3 (Δamu = 18) was observed at any stage of the fragmentation pathway.
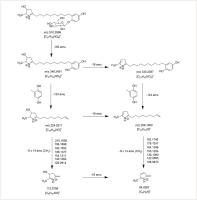 Fig. 4 Proposed MS2 fragmentation sequence of 3,4-dihydro-2H-pyrrole alkaloids tilliines A and B from lime flowers.
At this point, the molecule was assumed to consist of 4 main structural elements:
a 2-methyl-3,4-dihydro-2H-pyrrol-3-ol heterocycle, a C10 alkyl chain, a hydroquinone moiety, and a hexose residue.
For clarification of the relative configuration at position C-2 and C-3 of the heterocycle,
NOESY experiments were performed, which showed a cross peak of H-2/H-3. This indicated
cis-configuration of the H-2/H-3 protons ([Table 1]; Fig. 6fS, Supporting Information). Unfortunately, the elucidation of the absolute configuration
by formation of distinct diastereomers using Mosherʼs acid chloride remained unsuccessful.
The sugar moiety proposed from NMR and HR-MS data of 1a was identified after acid hydrolysis of the Sephadex LH-20 fraction C. TLC analysis against reference carbohydrates confirmed the presence of only glucose.
The thin-layer chromatogram is shown in the Supporting Information, Fig. 4S. The absolute configuration of D-glucose was established after derivatization and
separation of the diastereomers by CZE and comparison against the respective enantiomeric
reference compounds [15]. The CZE electropherogram is displayed in the Supporting Information (Fig. 5S). The β-configuration of the glycosidic linkage at the anomeric center was verified by the
13C signal of C-1‴ at δ
C 104.0 ppm, the corresponding 1H signal at δ
H 4.73 ppm, and the large coupling constant of 3J
H-1‴/H-2‴ = 7.8 Hz [16]. From these
investigations, the full structure of the 2-methyl-3,4-dihydro-2H-pyrrol-3-ol alkaloid 1a (tiliine A) was established ([Fig. 2]), which is, to our best knowledge, a previously undescribed natural product.
Detailed 1H, 13C, and COSY NMR data of 1b are reported in [Table 1]. Although compound 1b eluted in the analytical RP18-UHPLC as a shoulder of the compound 1a peak (Fig. 1S, Supporting Information), the peaks were sufficiently separated by preparative RP18-HPLC.
The similar retention time of both peaks suggested structural similarity. This assumption
was confirmed, as the UV spectrum (λ
max 278 nm), 1D and 2D NMR data, and HR-MS analysis showed the same structural features
and molecular skeleton ([Table 1]; Fig. 1S, 3bS, 7aS to 7fS, Supporting Information). Differences were only observed for the chemical shifts
of C-2/H-2 and C-3/H-3 of the 2-methyl-3,4-dihydro-2H-pyrrol-3-ol heterocycle. This suggested a different configuration at these positions.
NOESY correlations of H-2 and H-3 in compound 1b were not clearly
interpretable due to overlapping with the H-6‴ signals of the sugar moiety. Thus,
to determine the relative configuration, other correlations have to be taken into
account. As observed in the NOESY spectrum of compound 1a, the intensities of the cross peaks of H-3/H-4 and H-3/H-6 are comparable for the
cis-configuration. In the case of a trans-configuration of H-2 and H-3, the protons of H-3 and H-6 would be closer and the
intensity would be relatively higher compared with the signals of H-3 with H-4. This
was not the case in the NOESY spectrum of compound 1b, where the intensities of the cross-peaks H-3/H-4 and H-3/H-6 were similar as well
([Table 1]; Fig. 7fS, Supporting Information). As all the other NOESY cross-peaks were analogue to those
in compound 1a, compound 1b was assumed to be a diastereomer of compound 1a with cis-orientated C-2/C-3 substitution but with reversed
absolute configuration (Fig. 7fS, Supporting Information). The elucidation of the absolute stereochemistry was unsuccessful.
To our knowledge, the structure of the 2-methyl-3,4-dihydro-2H-pyrrol-3-ol alkaloid 1b (tiliine B) ([Fig. 1]) has not been described until now for a natural product.
Compound 2a was isolated from a single peak during preparative HPLC of fraction C. HR-MS showed
a quasi-molecular ion at m/z 512.3223, corresponding to the calculated molecular formula [C27H46NO8]+. The mass difference to the molecular weight determined for compounds 1a and 1b was 2.0142 amu, indicating 2 additional hydrogens in compound 2a. The UV spectrum showed a maximum of absorption at λ
max 284 nm, indicating the presence of a phenolic group (Fig. 3cS, Supporting Information). In MS2 spectrum, a neutral loss of 180.0651 amu was observed, representing a loss of a hexose
moiety, followed by an elimination of H2O. Detailed analysis of 1D and 2D NMR data revealed identical structural features
as observed for compounds 1a and 1b with regard to the β-linked hexose residue, which was determined by CZE as D-glucose ([Table 2]; Fig. 4S and 5S, Supporting Information). The glucose moiety was again linked to a 1,4-hydroquinone
moiety, substituted at C-2″ by an alkyl chain. Structural differences got obvious
in the NMR signals of the heterocyclic moiety. In contrast to compounds 1a and 1b, no downfield-shifted carbons were detectable. Instead, a 13C signal at δ
C 58.7 ppm (C-6) with 1 proton at δ
H 3.06 ppm (H-6) was observed, indicating a CH group in direct neighborhood to the
nitrogen atom. HMBC ([Fig. 3]; Fig. 8 eS, Supporting Information) and COSY cross peaks ([Table 2]; Fig. 8 fS, Supporting Information) revealed correlation to the alkyl chain on the one hand,
and on the other hand, to a 6-membered heterocycle of 5 carbons and 1 nitrogen atom,
which indicated a C-2/C-3-disubstituted piperidine ring system. The positions
C-2 (δ
C 57.5 ppm) and C-3 (δ
C 65.8 ppm) were assumed to be substituted with a methyl and a hydroxyl group, respectively.
These structural elements could also be verified by MS2 fragmentation analysis ([Fig. 5]), which showed after the loss of the hexose moiety and the elimination of H2O, a loss of a dihydroxy-methyl-phenyl moiety (Δ = 124.0506 amu). This resulted in
a hydroxyl-methyl-disubstituted alkyl-piperidine ring system, again eliminating alkyl
residues toward the final fragment of [C6H10N]+, which was in accordance with a double unsaturated methyl-piperidine ring. For clarification
of the relative configuration at C-2 and C-3 of the heterocycle, NOESY experiments
were performed, which clearly indicated cis-configuration of the H-2/H-3 protons ([Table 2]; Fig. 8fS, Supporting Information). No NOESY cross
peak was observed between the H-2/H-3 protons and the H-6 proton, indicating that
the H-6 proton is on the opposite side (trans) of the heterocycle. The elucidation of the absolute configuration was not successful.
Table 2 1H, 13C, COSY and NOESY spectroscopic data for compounds 2a and 2b.
|
2a
|
2b
|
|
Position
|
δ
C [ppm]
|
δ
H [ppm] (mult., J/Hz, No. H)
|
COSY
|
NOESY
|
δ
C [ppm]
|
δ
H [ppm] (mult., J/Hz, No. H)
|
COSY
|
NOESY
|
|
n. o.: no correlation observable
|
|
2
|
57.5
|
3.23 (m, 1H)
|
H-3, H-7
|
H-3, H-4a, H-7
|
52.0
|
3.47 (dd, J = 6.7, 2.7 Hz, 1H)
|
H-3, H-7
|
H-3, H-4b, H-7, H-1′a/b
|
|
3
|
65.8
|
3.84 (dt, J = 3.4, 1.6 Hz, 1H)
|
H-2, H-4a/b
|
H-2, H-4a/b, H-7
|
66.4
|
3.84 (dt, J = 5.9, 2.9 Hz, 1H)
|
H-2, H-4a/b
|
H-2, H-4a/b, H-5a, H-7
|
|
4a
|
31.0
|
1.72 (m, 1H)
|
H-3, H-4b, H-5a/b
|
H-3, H-4b, H-5a/b
|
26.2
|
1.77 (m, 1H)
|
H-3, H-4b, H-5a/b
|
H-3, H-4b, H-5b, H-7
|
|
4b
|
|
1.96 (m, 1H)
|
H-3, H-4a, H-5a/b
|
H-3, H-4a, H-5a
|
|
1.86 (ddt, J = 14.1, 10.6, 3.7 Hz, 1H)
|
H-3, H-4a, H-5a/b
|
H-2, H-3, H-4a, H-5a
|
|
5a
|
23.6
|
1.72 (m, 1H)
|
H-4, H-5b, H-6
|
H-4b, H-5b, H-6
|
22.2
|
1.57 (m, 1H)
|
H-4, H-5b, H-6
|
H-3, H-6, H-4b, H-5b,
|
|
5b
|
|
1.82 (m, 1H)
|
H-4, H-5a, H-6
|
H-4a, H-5a, H-6
|
|
2.14 (ddt, J = 14.8, 10.4, 4.4 Hz, 1H)
|
H-4, H-5a, H-6
|
H6-, H-4a, H-5a
|
|
6
|
58.7
|
3.06 (tdd, J = 11.7, 8.5, 4.2 Hz, 1H)
|
H-5a/b, H-1′
|
H-5a/b, H-1′a/b, H-3′–7′
|
53.6
|
3.34 (m, 1H)
|
H-5a/b, H-1′
|
H-5a/b, H-7, H-1′a/b, H-3′–7′
|
|
7
|
15.9
|
1.33 (m, 3H)
|
H-2
|
H-2, H-3
|
13.8
|
1.31 (m, 3H)
|
H-2
|
H-2, H-3, H-4a, H-6
|
|
1′a
|
34.7
|
1.57 (m, 1H)
|
H-1′b, H-2′
|
H-1′b
|
30.4
|
1.65 (dt, J = 8.8, 4.5 Hz, 1H)
|
H-1′b, H-2′
|
H-2, H-6, H-1′b
|
|
1′b
|
|
1.67 (m, 1H)
|
H-1′a, H-2′
|
H-1′a
|
|
1.78 (m, 1H)
|
H-1′a, H-2′
|
H-2, H-6, H-1′a
|
|
2′a
|
26.3
|
1.44 (ddd, J = 10.3, 5.8, 2.6 Hz, 1H)
|
H-1′, H-2′b, H-3′
|
n. o.
|
27.0
|
1.40 (m, 1H)
|
H-1′, H-2′b, H-3′
|
H-1′a/b
|
|
2′b
|
|
1.37 (m, 1H)
|
H-1′, H-2′a, H-3′
|
n. o.
|
|
1.44 (m, 1H)
|
H-1′, H-2′a, H-3′
|
H-1′a/b
|
|
3′–7′
|
30.4 – 30.5
|
1.35 – 1.37 (m, 10H)
|
H-2′a/b, H-8′
|
H-8′, H-9′a/b, H-6
|
30.4 – 30.5
|
1.32 – 1.37 (m, 10H)
|
H-2′a/b, H-8′
|
H-1′a/b, H-8′, H-9′a/b, H-6
|
|
8′
|
31.3
|
1.59 (m, 2H)
|
H-7′, H-9′a/b
|
H-3′–7′, H-9′a/b, H-3″
|
31.3
|
1.59 (t, J = 7.2 Hz, 2H)
|
H-7′, H-9′a/b
|
H-3′–7′, H-9′a/b, H-3″
|
|
9′a
|
31.0
|
2.59 (dt, J = 13.4, 7.7 Hz, 1H)
|
H-8′, H-9′b
|
H-8′, H-9′b, H-3″
|
31.0
|
2.59 (dt, J = 13.4, 7.7 Hz, 1H)
|
H-8′, H-9′b
|
H-8′, H-9′b, H-3″
|
|
9′b
|
|
2.69 (m, 1H)
|
H-8′, H-9′a
|
H-8′, H-9′a, H-3″
|
|
2.69 (dt, J = 13.5, 7.6 Hz, 1H)
|
H-8′, H-9′a
|
H-8′, H-9′a, H-3″
|
|
1″
|
150.3
|
–
|
–
|
–
|
150.3
|
–
|
–
|
–
|
|
2″
|
135.2
|
–
|
–
|
–
|
135.1
|
–
|
–
|
–
|
|
3″
|
117.3
|
6.57 (d, J = 3.0 Hz, 1H)
|
H-5″
|
H-3′–7′, H-8′, H-9′a/b
|
117.3
|
6.57 (d, J = 3.0 Hz, 1H)
|
H-5″
|
H-3′–7′, H-8′, H-9′a/b
|
|
4″
|
153.5
|
–
|
–
|
–
|
153.5
|
–
|
–
|
–
|
|
5″
|
113.8
|
6.55 (dd, J = 8.7, 3.0 Hz, 1H)
|
H-6″
|
H-6″
|
113.8
|
6.55 (dd, J = 8.7, 3.0 Hz, 1H)
|
H-6″
|
H-6″
|
|
6″
|
118.5
|
7.01 (d, J = 8.7 Hz, 1H)
|
H-5″
|
H-5″, H-1‴
|
118.5
|
7.01 (d, J = 8.7 Hz, 1H)
|
H-5″
|
H-5″, H-1‴
|
|
1‴
|
104.0
|
4.73 (d, J = 7.7 Hz, 1H)
|
H-2‴
|
H-6″, H-2‴–5‴
|
104.0
|
4.73 (d, J = 7.2 Hz, 1H)
|
H-2‴
|
H-6″, H-2‴–5‴
|
|
2‴
|
75.2
|
3.43 (m, 1H)
|
H-1‴
|
H-1‴
|
75.2
|
3.45 (m, 1H)
|
H-1‴
|
H-1‴
|
|
3‴
|
78.4
|
3.43 (m, 1H)
|
H-4‴
|
H-1‴
|
78.4
|
3.45 (m, 1H)
|
H-4‴
|
H-1‴
|
|
4‴
|
71.5
|
3.37 (m, 1H),
|
H-3‴
|
H-1‴, H-6‴a/b
|
71.5
|
3.37 (m, 1H),
|
H-3‴
|
H-1‴, H-6‴a/b
|
|
5‴
|
78.0
|
3.37 (m, 1H),
|
H-6‴
|
H-1‴, H-6‴a/b
|
78.0
|
3.37 (m, 1H),
|
H-6‴
|
H-1‴, H-6‴a/b
|
|
6‴a
|
62.6
|
3.70 (dd, J = 12.0, 5.2 Hz, 1H)
|
H-5‴, H-6‴b
|
H-6‴b
|
62.7
|
3.71 (dd, J = 12.0, 5.2 Hz, 1H)
|
H-5‴, H-6‴b
|
H-6‴b
|
|
6‴b
|
|
3.88 (dd, J = 12.0, 2.1 Hz, 1H)
|
H-5‴, H-6‴a
|
H-6‴a
|
|
3.89 (dd, J = 12.0, 2.1 Hz, 1H)
|
H-5‴, H-6‴a
|
H-6‴a
|
 Fig. 5 Proposed MS2 fragmentation sequence of piperidine alkaloids tiliamines A and B from lime flowers.
From these investigations, the structure of the piperidine alkaloid 2a (tiliamine A) can be deduced ([Fig. 1]), a previously undescribed natural product.
Compound 2b eluted during preparative HPLC directly after compound 2a. As the HR-MS of this compound had the same mass (m/z 512.3233) as compound 2a, structural similarities have to be assumed, which was confirmed by the identical
MS2 fragmentation pattern ([Fig. 5]) and UV spectrum (λ
max 285 nm) (Fig. 2S, 3dS, Supporting Information). Examination of the NMR data showed identical signals for
the hexose moiety, the hydroquinone moiety, and the alkyl chain, whereas differences
were apparent for the heterocycle, indicating a different configuration at positions
C-2, C-3, and C-6 compared to compound 2a ([Table 2]). NOESY correlations of 2b were identical to those obtained for 2a, which led to the conclusion that compound 2b should be a diastereomer of compound 2a with cis-orientated protons at C-2, C-3 and C-6 but
with reversed absolute configuration ([Table 2]; Fig. 9fS, Supporting Information). The elucidation of the absolute stereochemistry was not
successful.
From these investigations, the structure of the piperidine alkaloid 2b (tiliamine B) can be deduced ([Fig. 1]), which is, to our best knowledge, a previously undescribed natural product.
Compound 3a eluted after compounds 2a and 2b on preparative RP18-HPLC, which indicated a more lipophilic character of 3a as compared to the previous compounds. LC-HR-MS analysis showed a quasi-molecular
ion at m/z 554.3378, which corresponded to the molecular formula [C29H48NO9]+. The UV spectrum showed an absorption maximum at λ
max 285 nm (Fig. 3eS, Supporting Information). The mass difference of 42.0115 amu compared to compound
2a could be explained by an additional acetyl group. Analysis of 1D and 2D NMR data
again revealed strong similarities to the above described compounds regarding the
existence of a β-linked hexose residue, a 2-alkyl hydroquinone moiety, and an alkyl chain. Also, similar
signals were observed for the 2-methyl-piperidin-3-ol ring, but in contrast to compounds
2a and 2b, a downfield shift of the proton and the carbon at
position C-3 was observed, suggesting an acetyl group at the C-3 hydroxyl group.
Furthermore, in the 13C NMR spectrum, additional signals at δ
C 171.3 and 20.7 ppm confirmed the presence of an acetyl group. The correlation of
H-3 with the carbonyl-carbon at δC 171.3 in the HMBC spectrum ([Fig. 3]; Fig. 10eS, Supporting Information) confirmed the acetylation of the C-3 hydroxyl group. In
contrast to compounds 2a and 2b, the NOESY spectrum of compound 3a revealed the correlations of H-2, H-3, and H-6, indicating cis-configuration of all piperidine (C-2, C-3, and C-6) substituents ([Table 3]; Fig. 10fS, Supporting Information). The elucidation of the absolute stereochemistry was not
successful.
Table 3 1H, 13C, COSY, and NOESY spectroscopic data for compounds 3a and 3b.
|
3a
|
3b
|
|
Position
|
δ
C [ppm]
|
δ
H [ppm] (mult., J/Hz, No. H)
|
COSY
|
NOESY
|
δ
C [ppm]
|
δ
H [ppm] (mult., J/Hz, No. H)
|
COSY
|
NOESY
|
|
2
|
55.8
|
3.50 (qd, J = 6.7, 2.0 Hz, 1H)
|
H-3, H-7
|
H-3, H-4a, H-6, H-7
|
50.1
|
3.74 (m, 1H)
|
H-3, H-7
|
H-3, H-4b, H-7, H-1′a/b
|
|
3
|
69.2
|
5.10 (q, J = 2.6 Hz, 1H)
|
H-2, H-4a/b
|
H-2, H-4a/b, H-5a, H-7
|
69.4
|
5.05 (dt, J = 6.5, 3.2 Hz, 1H)
|
H-2, H-4a/b
|
H-2, H-4a/b, H-5a, H-7
|
|
4a
|
28.0
|
1.82 (dddd, J = 14.7, 13.5, 4.3, 2.6 Hz, 1H)
|
H-3, H-4b, H-5a/b
|
H-2, H-3, H-4b, H-5b, H-6
|
23.2
|
1.89 (m, 1H)
|
H-3, H-4b, H-5a/b
|
H-3, H-4b, H-5b, H-7
|
|
4b
|
|
2.06 (dq, J = 14.0, 3.0 Hz, 1H)
|
H-3, H-4a, H-5a/b
|
H-3, H-4a, H-5a/b
|
|
1.96 (m, 1H)
|
H-3, H-4a, H-5a/b
|
H-2, H-3, H-4a, H-5a, H-1′a/b
|
|
5a
|
24.1
|
1.57 (m, 1H)
|
H-4, H-5b, H-6
|
H-3, H-4a/b, H-5b, H-6
|
22.8
|
1.66 (m, 1H)
|
H-4, H-5b, H-6
|
H-2, H-6, H-4b, H-5b, H-1′b, H-2′a
|
|
5b
|
|
1.94 (ddt, J = 10.2, 6.8, 3.2 Hz, 1H)
|
H-4, H-5a, H-6
|
H-4a/b, H-5a, H-6, H-1′a/b, H-2′a/b
|
|
2.07 (m, 1H)
|
H-4, H-5a, H-6
|
H-4a, H-5a, H-6
|
|
6
|
58.5
|
3.18 (m, 1H)
|
H-5a/b, H-1′
|
H-4a, H-5b, H-1′a/b, H-2′a/b, H-3′–7′
|
53.5
|
3.43 (m, 1H)
|
H-5a/b, H-1′
|
H-5a/b, H-7, H-1′a/b, H-2′a
|
|
7
|
15.5
|
1.29 (d, J = 6.7 Hz, 3H)
|
H-2
|
H-2, H-3, H-2*
|
13.5
|
1.31 (m, 3H)
|
H-2
|
H-2, H-3, H-4a, H-5b, H-6
|
|
1′a
|
34.6
|
1.62 (m, 1H)
|
H-1′b, H-2′
|
H-1′b, H-2′a/b, H-3′–7′
|
30.6
|
1.67 (m, 1H)
|
H-1′b, H-2′
|
H-2, H-6, H-1′b, H-2′a/b
|
|
1′b
|
|
1.72 (m, 1H)
|
H-1′a, H-2′
|
H-1′a, H-2′a/b, H-3′–7′
|
|
1.79 (m, 1H)
|
H-1′a, H-2′
|
H-2, H-6, H-1′a, H-2′a/b
|
|
2′a
|
26.2
|
1.40 (m, 1H)
|
H-1′, H-2′b, H-3′
|
H-1′a/b, H-2′b, H-3′–7′
|
26.9
|
1.40 (m, 1H)
|
H-1′, H-2′b, H-3′
|
H-1′a/b, H-2′b, H-3′–7′
|
|
2′b
|
|
1.48 (m, 1H)
|
H-1′, H-2′a, H-3′
|
H-1′a/b, H-2′a, H3′–7′
|
|
1.42 (m, 1H)
|
H-1′, H-2′a, H-3′
|
H-1′a/b, H-2′a, H-3′–7′
|
|
3′–7′
|
30.4 – 30.5
|
1.36 (m, 10H)
|
H-2′a/b, H-8′
|
H-8′, H-9′a/b, H-6
|
30.4 – 30.6
|
1.35 (m, 10H)
|
H-2′a/b, H-8′
|
H-8′, H-9′a/b, H-6
|
|
8′
|
31.3
|
1.60 (m, 2H)
|
H-7′, H-9′a/b
|
H-3′–7′, H-9′a/b, H-3″
|
31.3
|
1.59 (t, J = 7.3 Hz, 2H)
|
H-7′, H-9′a/b
|
H-3′–7′, H-9′a/b, H-3″
|
|
9′a
|
31.0
|
2.59 (dt, J = 13.5, 7.7 Hz, 1H)
|
H-8′, H-9′b
|
H-8′, H-9′b, H-3″
|
31.0
|
2.59 (dt, J = 13.4, 7.6 Hz, 1H)
|
H-8′, H-9′b
|
H-8′, H-9′b, H-3″
|
|
9′b
|
|
2.69 (dt, J = 13.4, 7.6 Hz, 1H)
|
H-8′, H-9′a
|
H-8′, H-9′a, H-3″
|
|
2.69 (dt, J = 13.4, 7.6 Hz, 1H)
|
H-8′, H-9′a
|
H-8′, H-9′a, H-3″
|
|
1″
|
150.3
|
–
|
–
|
–
|
150.3
|
–
|
–
|
–
|
|
2″
|
135.2
|
–
|
–
|
–
|
135.1
|
–
|
–
|
–
|
|
3″
|
117.3
|
6.57 (d, J = 3.0 Hz, 1H)
|
H-5″
|
H-3′–7′, H-8′, H-9′a/b
|
117.3
|
6.57 (d, J = 3.0 Hz, 1H)
|
H-5″
|
H-3–H7′, H-8′, H-9′a/b
|
|
4″
|
153.5
|
–
|
–
|
–
|
153.5
|
–
|
–
|
–
|
|
5″
|
113.8
|
6.55 (dd, J = 8.7, 3.0 Hz, 1H)
|
H-6″
|
H-6″
|
113.8
|
6.55 (dd, J = 8.7, 3.0 Hz, 1H)
|
H-6″
|
H-6″
|
|
6″
|
118.5
|
7.01 (d, J = 8.7 Hz, 1H)
|
H-5″
|
H-5″, H-1‴
|
118.5
|
7.01 (d, J = 8.7 Hz, 1H)
|
H-5″
|
H-5″, H-1‴
|
|
1‴
|
104.0
|
4.74 (d, J = 7.7 Hz, 1H)
|
H-2‴
|
H-6″, H-2‴-5‴
|
104.0
|
4.73 (d, J = 7.6 Hz, 1H)
|
H-2‴
|
H-6″, H-2‴–5‴
|
|
2‴
|
75.2
|
3.44 (m, 1H)
|
H-1‴
|
H-1‴
|
75.2
|
3.45 (m, 1H)
|
H-1‴
|
H-1‴
|
|
3‴
|
78.4
|
3.44 (m, 1H)
|
H-4‴
|
H-1‴
|
78.4
|
3.45 (m, 1H)
|
H-4‴
|
H-1‴
|
|
4‴
|
71.5
|
3.38 (m, 1H),
|
H-3‴
|
H-1‴, H-6‴a/b
|
71.6
|
3.38 (m, 1H),
|
H-3‴
|
H-1‴, H-6‴a/b
|
|
5‴
|
78.0
|
3.38 (m, 1H),
|
H-6‴
|
H-1‴, H-6‴a/b
|
78.0
|
3.38 (m, 1H),
|
H-6‴
|
H-1‴, H-6‴a/b
|
|
6‴a
|
62.6
|
3.71 (dd, J = 11.9, 5.2 Hz, 1H)
|
H-5‴, H-6‴b
|
H-6‴b
|
62.7
|
3.72 (m, 1H)
|
H-5‴, H-6‴b
|
H-6‴b
|
|
6‴b
|
|
3.89 (dd, J = 12.0, 2.2 Hz, 1H)
|
H-5‴, H-6‴a
|
H-6‴a
|
|
3.89 (dd, J = 12.1, 2.1 Hz, 1H)
|
H-5‴, H-6‴a
|
H-6‴a
|
|
1*
|
171.3
|
–
|
–
|
–
|
171.3
|
–
|
–
|
–
|
|
2*
|
20.7
|
2.15 (s, 3H)
|
–
|
H-3, H-7
|
20.7
|
2.13 (s, 3H)
|
–
|
–
|
The MS fragmentation pattern of compound 3a was very similar to the pattern of the non-acetylated compounds 2a and 2b, as esterified hydroxyl groups are typically eliminated under formation of a double
bond (Δamu = 60). As the only difference, ions indicative of the respective hydroxylated
fragments were absent.
From these investigations, the structure of the 3-O acetylated-piperidine alkaloid 3a (tilacetine A) was deduced ([Fig. 1]), which is, to our best knowledge, a previously undescribed natural product.
Compound 3b eluted after compound 3a on preparative RP18-HPLC and exhibited the same m/z 554.3382 [M + H]+, UV (λ
max 285 nm), 1D and 2D NMR data, as well as MS fragmentation pattern. Differences were
observed with regard to the relative configuration. In the NOESY spectrum, a cross
peak between H-2 and H-3 was visible, but a correlation with H-6 was absent. This
indicated a cis-configuration of substituents at C-2 and C-3 as observed for compounds 2a and 2b ([Table 3]; Fig. 11fS, Supporting Information). The elucidation of the absolute configuration was not successful.
The HMBC and NOESY correlations between the acetyl group with the heterocycle were
missing, probably because of the lower amount of compound 3b. However, the downfield shift of the proton and carbon at position 3 unambiguously
indicated that this position was acetylated in this compound as
well.
These data established the structure of the 3-O acetylated-piperidine alkaloid 3b (tilacetine B) ([Fig. 1]), which is, to our best knowledge, a previously undescribed natural product.
LC-HR-MS2 analysis of fraction C indicated the existence of a further alkaloid with m/z of 552.3230, which could have
structural similarity to acetyl-tiliine (Figs. S1 and S2, Supporting Information). The exact structure could not be established by detailed
NMR studies due to the very low amounts obtained during the isolation process.
To determine the absolute amount of the 6 Tilia alkaloids in different plant materials, extracts were prepared from T. platyphyllos and T. cordata, as well as from Tiliae flos, which represents a mixture of both species, including
also potential hybrids according to the European Pharmacopoeia. Additionally, extracts
from different organs of T. platyphyllos (flowers without bracts, leaves) were prepared, and various extraction solvents were
tested for their potential to solubilize the alkaloids (acetone/water 7 : 3, ethanol
96%, and ethanol 50%). Since lime flowers are traditionally used for medicinal purposes
as herbal teas prepared by hot water extraction, an infusion was also included in
the investigation. Quantification was performed using HPLC-ESI-qTOF after calibration
with the respective alkaloids in concentrations of 5.0 – 0.1 µg/mL each. The amounts
of the individual alkaloids are displayed in [Table 4] and
[Fig. 6].
Table 4 Extract yields after lyophilization from different Tilia species and plant organs in relation to the used solvent system and respective amounts
of each Tilia alkaloid [%], related to the dry extract. DER: drug-extract-ratio; 1a: tiliine A, 1b: tiliine B, 2a: tiliamine A, 2b: tiliamine B, 3a: tilacetine A, 3b: tilacetine B.
|
Plant material
|
Extraction solvent
|
Dried plant material [g]
|
Yield [g]
|
Yield [%, w/w]
|
DER
|
Amount of Tilia alkaloids [mg/g dry extract]
|
|
1a
|
1b
|
2a
|
2b
|
3a
|
3b
|
|
I
|
Tiliae flos
|
acetone/water (7 : 3 v/v)
|
1300.0
|
225.95
|
17.4
|
5.7 : 1
|
1.71
|
1.05
|
< 0.1
|
< 0.1
|
0.89
|
1.27
|
|
II
|
Tilia platyphyllos flowers
|
acetone/water (7 : 3 v/v)
|
151.0
|
30.84
|
20.4
|
4.9 : 1
|
0.90
|
0.43
|
< 0.1
|
< 0.1
|
1.18
|
0.79
|
|
III
|
Tilia cordata flowers
|
acetone/water (7 : 3 v/v)
|
68.0
|
12.01
|
17.6
|
5.7 : 1
|
0.61
|
0.24
|
< 0.1
|
< 0.1
|
0.26
|
0.85
|
|
IV
|
Tilia platyphyllos flowers without bracts
|
acetone/water (7 : 3 v/v)
|
10.0
|
1.91
|
19.1
|
5.2 : 1
|
0.72
|
0.32
|
< 0.1
|
< 0.1
|
0.35
|
1.08
|
|
V
|
Tilia platyphyllos bracts
|
acetone/water (7 : 3 v/v)
|
10.0
|
0.71
|
7.1
|
14.1 : 1
|
0.55
|
0.24
|
< 0.1
|
< 0.1
|
0.36
|
1.43
|
|
VI
|
Tilia platyphyllos leaves
|
acetone/water (7 : 3 v/v)
|
10.0
|
1.09
|
10.9
|
9.2 : 1
|
0.17
|
0.10
|
< 0.1
|
< 0.1
|
0.38
|
0.90
|
|
VII
|
Tiliae flos
|
ethanol 96%
|
10.0
|
0.23
|
2.3
|
43.5 : 1
|
1.07
|
0.50
|
< 0.1
|
< 0.1
|
0.39
|
0.88
|
|
VIII
|
Tiliae flos
|
ethanol 50%
|
10.0
|
1.67
|
16.7
|
6.0 : 1
|
0.80
|
0.38
|
< 0.1
|
< 0.1
|
0.22
|
0.50
|
|
IX
|
Tiliae flos
|
infuse
|
1.5
|
0.21
|
13.9
|
7.2 : 1
|
0.46
|
0.20
|
< 0.1
|
< 0.1
|
0.27
|
0.38
|
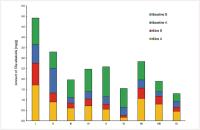 Fig. 6 Absolute amounts [mg/g] of Tilia alkaloids in extracts, obtained by different solvents or from different plant material.
I: Tiliae flos (acetone/water 7 : 3), II: Tilia platyphyllos flowers (acetone/water 7 : 3), III: Tilia cordata flowers (acetone/water 7 : 3), IV: Tilia platyphyllos flowers without bracts (acetone/water 7 : 3), V: Tilia platyphyllos bracts (acetone/water 7 : 3), VI: Tilia platyphyllos leaves (acetone/water 7 : 3), VII: Tiliae flos (ethanol 96%), VIII: Tiliae flos (ethanol 50%), IX: Tiliae flos (infusion). The amounts of tiliamine A and tiliamine B are < 0.1 mg/g
for all samples and are therefore not displayed in this figure.
Fig. 6 Absolute amounts [mg/g] of Tilia alkaloids in extracts, obtained by different solvents or from different plant material.
I: Tiliae flos (acetone/water 7 : 3), II: Tilia platyphyllos flowers (acetone/water 7 : 3), III: Tilia cordata flowers (acetone/water 7 : 3), IV: Tilia platyphyllos flowers without bracts (acetone/water 7 : 3), V: Tilia platyphyllos bracts (acetone/water 7 : 3), VI: Tilia platyphyllos leaves (acetone/water 7 : 3), VII: Tiliae flos (ethanol 96%), VIII: Tiliae flos (ethanol 50%), IX: Tiliae flos (infusion). The amounts of tiliamine A and tiliamine B are < 0.1 mg/g
for all samples and are therefore not displayed in this figure.
Tilia alkaloids were detected in all investigated extracts. Best extraction was achieved
by use of acetone/water mixture as solvent while lower amounts were extracted by ethanol
and ethanol/water mixtures. Also the hot water extract contained relevant alkaloid
amounts, but less than had been extracted by organic solvents. It is important to
note that tiliamine A and tiliamine B could be detected in all extracts, but the amount
was lower than the lowest calibration level. Therefore, the amount of tiliamine A
and tiliamine B has to be declared as < 0.1 mg/g extract. This is in contrast to results
of the isolation, where tiliamine A and tiliamine B were obtained in the highest yields.
This might be explained by a specific enrichment regarding these compounds or by deacetylation
of acetylated derivatives.
During the alkaloid quantification, the alkaloids were found to be present in T. cordata as well as in T. platyphyllos. Interestingly, the alkaloids can be extracted from leaves, flowers, and bracts of
T. platyphyllos, indicating that they are widely distributed all over the plant and are not exclusively
accumulated in the flowers.
Discussion
Three pairs of previously undescribed alkaloids have been identified from lime flower.
They include the 3,4-dihydro-2H-pyrrole alkaloids tiliines A and B, the piperidine alkaloids tiliamines A and B,
and the acetylated piperidine alkaloids tilacetines A and B. We assume that the nonacetylated
products are in part due to de-esterification during the isolation process, which
uses ammonia for alkalization. On the other side, we can identify by HPLC the nonacetylated
compounds also in extracts, which had not been in contact with alkaline solvents.
This indicates that both nonesterified and acetylated compounds are formed biosynthetically.
The proposed structure of the glycosylated alkyl-piperidine and alkyl-dihydropyrrole
alkaloids is in good accordance to some already known alkaloids with similar structural
features. Melhaoui et al. reported the existence of an alkaloid called irniine from
Arisarum vulgare (Araceae), with an N-methyl-pyrrolidine heterocycle
linked to a phenyl group via a C9 alkyl chain [17]. Additionally, the authors isolated a 2-methyl-piperidin-3-ol alkaloid called irnigaine
with the same phenylalkyl chain [17]. Su et al. identified a 2-methyl-pyrrolidin-3-ol alkaloid with a C10 alkyl chain
and a phenyl ring in Arisaema franchetianum (Araceae) tubers [18]. In rhizomes from Alocasia macrorrhiza (Araceae), Huang et al. detected a variety of 2-methyl-piperidin-3-ol alkaloids again
linked to a phenyl ring via a C9 alkyl chain [19]. As all these plants from the Araceae family belong to the monocotyledons, it is
interesting that compounds with similar structural features, as the Tilia alkaloids described here, appear also in dicotyledons. Piperidine alkaloids with
2-methyl-3-hydroxy-6-alkyl (saturated) substitution but without phenyl substituent
at the end of the
alkyl chain have been described in the genera Senna, Cassia, and Prosopis (Fabaceae) [20], [21], [22], [23], [24], [25]. Similar piperidine alkaloids with predominantly unsaturated alkyl chains have been
found in the marine hydroid Corydendrium parasiticum (Clavidae) and in the genus Microcos (Malvaceae) [12], [26], [27], [28], [29], [30]. This genus was formerly classified into the family Tiliaceae, which is now turned
into the subfamily, Tilioideae, within the Malvaceae family. At present, the genus
Microcos is classified in the subfamily, Grewioideae. Apart from the genus Microcos,
alkaloids in general appear in the family of Malvaceae up to now only in the genus
Sida (indoquinoline alkaloids) [12], [13], [14].
Despite detailed structural investigation on the isolated alkaloids, the absolute
configuration at the heterocycle still remains to be determined. Unfortunately, CD
spectroscopic investigations of the alkaloids did not turn out to be helpful, as the
chromophore of the phenyl system is too far away from the relevant piperidine/dihydropyrrole
system. Also, derivatization with Mosherʼs acid chloride and subsequent NMR investigations
failed, as the used reagents reacted not only with the hydroxyl function of the heterocycle,
but also with the carbohydrate part of the molecule, leading to highly complex mixtures
that hamper unambiguous NMR interpretation. Using NMR data sets for already known
compounds with similar structural features, it might be interesting to refer to leptophyllin
B, which has a 2R, 3R, 6R configurated 2-methyl-6-alkyl piperidin-3-ol heterocycle
[21]. NMR data of this compound are very similar to those of the above described
compound 2a, so that it may be speculated that the piperidine heterocycle of compound 2a could have a 2R, 3R, 6R configuration as well. Our investigation reveals that lime
flowers contain interesting alkaloids not described in nature until now. Taking the
quantification data into account, an effective isolation also could be performed in
the future from leaf material, which is easily and economically available.
Further studies are warranted to investigate the role of these alkaloids as a potential
plant defense system and to explore their biological properties in order to determine
if pharmacological activities related to symptoms of the common cold and/or mental
stress could be affected by these compounds or even by the extract.
Materials and Methods
Plant material
Dried and cut herbal material from lime flower (batch no. 18 005 504, voucher sample
IPBP 519) was obtained in a quality according to the specifications of the European
Pharmacopoeia (Ph. Eur. 9.0) [3] from Caesar & Loretz. Plant material from T. platyphyllos and T. cordata was collected on June 16, 2019 and July 2, 2019 at the Medicinal Plant Botanical
Garden of the University of Münster (Germany, 51°57′54.5″N 7°36′24.4″E) and identified
by the authors AH and NS. Reference samples (voucher samples IPBP 512 and IPBP 513)
are deposited in the Institute of Pharmaceutical Biology and Phytochemistry (Münster,
Germany). Plant material of T. platyphyllos was again collected on June 22, 2020 and manually separated into flowers, floral
bracts, and leaves (voucher samples IPBP 525, IPBP 526, and IPBP 527).
General experimental procedures
If not stated otherwise, solvents and reagents were of analytical quality and obtained
from VWR International. Consumables were obtained from Sarstedt. Ultrapure water was
produced by a Millipore simplicity 185 system. UV/VIS spectroscopic data were recorded
on a Hitachi U-2900 spectrophotometer at room temperature using a Hellma 10 mm quartz
glass cuvette. The samples were dissolved in methanol at a concentration of 0.1 mg/mL,
and methanol was used a blank. The UV/Vis spectra are shown in the Supporting Information
(Fig. 3S, Supporting Information). One- and 2-dimensional NMR spectroscopic experiments were
carried out using an Agilent DD2 spectrometer (Agilent Technologies, Santa Clara,
USA) at 600 MHz (1H) or 150 MHz (13C) at 299 K. Samples were dissolved in methanol-d4 (≥ 99.8% D). Chemical shifts (ppm) were referenced to the residual signals of nondeuterated
solvent (1H: 4.870 ppm and 3.31 ppm) and the 13C
isotope signal at 49.00 ppm. The 1D and 2D NMR spectra are shown in the Supporting
Information (Fig. 6S to 11S, Supporting Information).
Extraction of lime flowers and isolation of alkaloids
Extraction was carried out as displayed in [Fig. 1] according to a method described recently [9]. Dried and cut lime flower (1.3 kg) was extracted in aliquots of 100 g (2 × 1000 mL
with a mixture of cold acetone/water (7 : 3 v/v) under exclusion of direct light. After removal of acetone under vacuo, chlorophyll was removed from the extracts by liquid-liquid partitioning of the remaining
aqueous phase with petroleum ether (5 × 600 mL for each extraction step), resulting
in 225 g (17% w/w, related to the starting material) of extract A.
A portion (80 g) of extract A was fractionated by Bond Elute Plexa PCX cationic exchange
solid phase extraction (SPE) (200 mg, 6 mL, Agilent). The extract was dissolved in
H3PO4 (2% in methanol/water, [1 : 1 v/v]) at a concentration of 100 mg/mL. The SPE separation was performed in accordance
with the specifications given by the manufacturer. After activation with methanol
and equilibration with water, 3 mL of the sample solution was loaded on the cartridge
and subsequently eluted, each with 6 mL of formic acid (2% in water), methanol/acetonitrile
(1 : 1 v/v), 5% NH3 in methanol/acetonitrile (1 : 1 v/v), and 5% NH3 in methanol/water (1 : 1 v/v). Every elution step yielded a fraction that was subsequently monitored by UHPLC-ESI-MS
on RP18 stationary phase, as described below. Tilia alkaloids eluted as basic fraction B with 5% NH3 in methanol/acetonitrile, yielding 1.42 g (1.78%
[w/w] related to the extract A and 0.31%, related to the dried plant material).
Further fractionation of fraction B was performed on Sephadex LH-20 (345 × 30 mm;
bed volume 244 mL); 1.42 g of B was dissolved in 15 mL of 5% NH3 in ethanol/water (1 : 1 v/v), and successively separated in 3 portions of 5 mL each. Isocratic elution was performed
with 250 mL of 5% NH3 in ethanol/water (1 : 1 v/v) at a flow rate of 0.8 mL/min. This fractionation yielded 25 fractions of 10 mL.
Monitoring of all fractions by UHPLC-ESI-MS indicated that the alkaloids, together
with minor amounts of nonalkaloid compounds, eluted between 180 and 210 mL. Alkaloid-containing
fractions were combined, yielding 367 mg of a Tilia alkaloids-enriched fraction C (0.46% [w/w] related to the extract A). Fraction C accounted for 0.08% related to the dried plant
material.
Final isolation and purification of individual alkaloids from fraction C were performed
by preparative HPLC. The system consisted of a Waters Quaternary Gradient Module 2545,
a Photodiode Array Detector 2998, an Autosampler 2707, a Waters Prep Degasser, and
a Waters Fraction Collector III. Data were recorded and analyzed with Waters ChromScope
v1.40 Beta software. A Nucleodur C18 HTec column (5 µm, 250 × 21 mm, Macherey-Nagel)
was used for separation. The mobile phase consisted of water/trifluoroacetic acid
(98 : 2 v/v) (A) and acetonitrile/trifluoroacetic acid (98 : 2 v/v) (B). The following gradient was applied: 0 to 16 min: linear from 0 to 18% B; 16
to 56 min: linear from 18 to 30% B; 56 to 64 min: linear from 30 to 100% B; 64 to
68 min: isocratic at 100% B; 68 to 72 min: linear from 100 to 0% B; 72 to 80 min:
isocratic at 0% B. The flow rate was 10.0 mL/min. Column temperature: ambient temperature
in an air-conditioned lab with 20 °C. Sample
concentration: 20 mg/mL. Injection volume: 1 mL. Number of injections: 19. This
procedure yielded compounds 1a (3.9 mg, t
R = 38 min), 1b (3.9 mg, t
R = 39 min), 2a (5.3 mg, t
R = 44 min), 2b (6.9 mg, t
R = 45 min), 3a (2.6 mg, t
R = 53 min), and 3b (2.0 mg, t
R = 55 min).
Monitoring of fractions by UHPLC
SPE, Sephadex LH-20, and preparative HPLC-fractions were monitored for the presence
of Tilia alkaloids using an UHPLC-ESI-MS system and an Acquity UPLC HSS T3 (1.8 µm, 2.1 × 100 mm)
column (Waters). Mobile phase: (A) water with formic acid 0.1%; (B) acetonitrile with
0.1% formic acid; 0 to 4 min: linear from 0 to 18% B; 4 to 14 min: 18 to 30% B; 14
to 16 min: 30 to 100% B; 16 to 17 min: isocratic at 100% B; 17 to 18 min: 100 to 0%
B; 18 to 20 min: isocratic at 0% B. Column temperature: 40 °C. Flow rate: 0.5 mL/min.
Injection volume: 4 µL. Eluted compounds were detected using a Waters PDA eλ over a wavelength range of λ = 200 to 800 nm and a Waters QDa mass spectrometer in the positive ion mode with
a cone voltage of 15 V and a capillary voltage of 0.8 V.
UHPLC-HR-MS analysis
UHPLC-ESI-qTOF-MS analysis was performed using a Dionex Ultimate 3000 RS Liquid Chromatography
System on a Waters Acquity UPLC BEH C18 (2.1 × 100 mm, 1.7 µm) column at a temperature
of 40 °C. Injection volume: 10 µL. Flow rate: 0.4 mL/min. Samples were dissolved in
methanol/water (1 : 9 v/v) at a concentration of 10 mg/mL. The mobile phase consisted of water with 0.1% formic
acid (A) and acetonitrile with 0.1% formic acid (B). Gradient: tR 0.00 to 9.00 min linear from 15% B initially to 38% B; 9.00 to 9.02 min linear from
38 to 100% B; 9.02 to 15.00 min isocratic at 100% B; 15.00 to 15.10 min linear from
100 to 15% B; 15.10 to 20.00 min isocratic equilibration at 15% B. Eluted compounds
were detected using a Dionex Ultimate DAD-3000 RS over a wavelength range of λ = 200 to 400 nm and a Bruker Daltonics micrOTOF-QII time-of-flight mass spectrometer
equipped with an Apollo electrospray ionization source in positive mode at 3 Hz over
a mass range of
m/z 50 – 1500 using the following instrument settings: nebulizer gas nitrogen: 3.0 bar;
dry gas nitrogen: 9 L/min, 200 °C; capillary voltage: 4500 V; end plate offset: 500 V;
transfer time: 100 µs, prepulse storage: 6 µs, collision energy: 8 eV. MS/MS scans
were triggered by AutoMS2 settings within a range of m/z 50 – 1500, using a collision energy of 70 eV and collision cell RF of 130 Vpp. The
extracted ion chromatograms of extract A from lime flowers and the respective MS2 spectra are shown in the Supporting Information (Fig. 1S and 2S, Supporting Information).
Hydrolysis of alkaloid glycosides and identification of hexose residue
Alkaloid glycosides in Sephadex LH-20 fraction C (3 mg) were hydrolyzed by addition
of 23% trifluoroacetic acid (TFA) at 120 °C for 1 h as described by Albersheim et
al. [31]. After removal of TFA by 3 washing steps each with 2 mL methanol/water (1 : 1 v/v), the released carbohydrates were identified by TLC on silica gel G60 F254 10 × 20 cm
plates and compared to the respective reference carbohydrates. Mobile phase: n-propanol/water/ethanol (7 : 2 : 1 v/v/v). Spray reagent: ethanolic thymol/sulfuric acid solution. The chromatogram is shown
in the Supporting Information (Fig. 4S).
Capillary zone electrophoresis (CZE) was performed after derivatization of the monosaccharides
as described by Noe et al. [15] on a Beckman Coulter P/ACE MDQ. Separation parameters: fused silica capillary 70/77 cm × 50 µm
i. d. running buffer: Na2B2O7 50 mM pH 10.3, acetonitrile 4.4 mol/L added. Injection: 5 to 10 s at 0.5 psi. Voltage:
30 kV. Detection: λ = 200 nm. Software: 32 Karat version 5.0 (Beckman Coulter). The electropherograms
are shown in the Supporting Information (Fig. 5S).
Quantification of Tilia alkaloids
For quantification of the alkaloids, 9 different extracts from different plant samples
were investigated. In addition to extract A from commercially available lime flower,
self-collected plant material from either T. cordata or T. platyphyllos was extracted with acetone/water (7 : 3 v/v) as mentioned above. Plant material obtained from T. platyphyllos was divided into flowers, floral bracts, and leaves, and all plant parts were separately
extracted and investigated. Additionally, the commercially available lime flower batch
was extracted with ethanol 96% and ethanol 50%. A lime flower infusion was prepared
by adding 150 mL of boiling water to 1.5 g of commercially available lime flower.
After 15 min, the plant material was removed by filtration, and the hot water extract
was lyophilized. Quantification was performed using the above mentioned UHPLC-ESI-qTOF
system, with the following modifications: sample concentration: 1 mg/mL, dissolved
in
methanol/water (1 : 9 v/v), injection volume 5 µL, number of injections: 2 (calibrants), 3 (samples), deactivated
Auto-MS2 function. Calibration solutions of the 6 Tilia alkaloids were prepared in methanol/water (1 : 9 v/v) at following 6 concentrations: 5.0, 2.0, 1.0, 0.5, 0.2, and 0.1 µg/mL. Quantification
was based on the analysis of extracted ion chromatograms of the respective m/z values 510, 512, and 554 by QuantAnalysis software (Bruker) and Microsoft Excel.
Although peaks of the diastereomers (e.g., m/z 510) were not baseline separated, the displayed chromatographic system achieved the
best separation of tested systems. Respective peaks were divided at the peak valley
for integration. The respective yields obtained from the extracts and the concentration
of the 6 Tilia alkaloids in the respective extracts are shown in [Table 4] and [Fig. 6].
Compound characterization
Compound 1a (tiliine A)
Pale yellow oil. HR-ESI-MS: m/z 510.3081 [M + H]+ (calculated for [C27H44NO8]+, 510.3061). 1H and 13C NMR data: see [Table 1]. 1D and 2D NMR spectra (gCOSY, gHSQC, gHMBC, NOESY) are displayed in the Supporting
Information, Figs. 6aS to 6fS.
Compound 1b (tiliine B)
Pale yellow oil. HR-ESI-MS: m/z 510.3089 [M + H]+ (calculated for [C27H44NO8]+, 510.3061). 1H and 13C NMR data: see [Table 1]. 1D and 2D NMR spectra (gCOSY, gHSQC, gHMBC, NOESY) are displayed in the Supporting
Information, Figs. 7aS to 7fS.
Compound 2a (tiliamine A)
Pale yellow oil. HR-ESI-MS: m/z 512.3223 [M + H]+ (calculated for [C27H46NO8]+, 512.3218). 1H and 13C NMR data: see [Table 2]. 1D and 2D NMR spectra (gCOSY, gHSQC, gHMBC, NOESY) are displayed in the Supporting
Information, Figs. 8aS to 8fS.
Compound 2b (tiliamine B)
Pale yellow oil. HR-ESI-MS: m/z 512.3233 [M + H]+ (calculated for [C27H46NO8]+, 512.3218). 1H and 13C NMR data: see [Table 2]. 1D and 2D NMR (gCOSY, gHSQC, gHMBC, NOESY) spectra are displayed in the Supporting
Information, Figs. 9aS to 9fS.
Compound 3a (tilacetine A)
Pale yellow oil. HR-ESI-MS: m/z 554.3378 [M + H]+ (calculated for [C29H48NO9]+, 554.3324). 1H and 13C NMR data: see [Table 3]. 1D and 2D NMR (gCOSY, gHSQC, gHMBC, NOESY) spectra are displayed in the Supporting
Information, Figs. 10aS to 10fS.
Compound 3b (tilacetine B)
Pale yellow oil. HR-ESI-MS: m/z 554.3382 [M + H]+ (calculated for [C29H48NO9]+, 554.3324). 1H and 13C NMR data: see [Table 3]. 1D and 2D NMR (gCOSY, gHSQC, gHMBC, NOESY) spectra are displayed in the Supporting
Information, Figs. 11aS to 11fS.
Contributorsʼ Statement
The manuscript was written through contributions of all authors. All authors give
approval to the final version of the manuscript. Experimental work was performed by
NS, MB, JS, AH.


