Keywords
forced-choice - speech recognition - speech-recognition threshold
There is a growing interest in the development of methods that reduce the dependence
of basic hearing testing on highly trained testers. This interest stems from the goals
of increasing access to hearing testing and more efficient use of professional time.
Conventional methods used by audiologists for basic testing (pure-tone and speech
audiometry) are based on a set of rules that are easily encoded in software. Once
the rules are agreed upon, an automated method can implement them in a standardized
way, avoiding errors and shortcuts that occur in conventional testing. The quality
indicators that are consciously and unconsciously used by expert audiologists to ensure
test accuracy can be embedded in the procedure, providing quantitative estimates of
accuracy. Automated pure-tone audiometry (AMTAS) has been found to produce results
that are equivalent to those obtained by expert audiologists[1]
[2] especially when quality indicators are incorporated into the protocol.[3]
Speech recognition is routinely tested in the basic clinical hearing evaluation. Typically,
speech materials are presented in quiet or noise in open-set paradigms with the tester
scoring the listeners' verbal repetition of the stimuli. Two approaches have been
used to automate speech-recognition tests. Automatic speech-recognition software has
been used to score the listeners responses. In our experience, automatic speech-recognition
produced accurate speech-recognition threshold (SRT) measurements with spondee stimuli
but was not adequate to accurately score responses to monosyllabic words spoken by
listeners with a wide range of speech production characteristics.[4] Ooster et al (2020)[5] reported that automatic speech recognition accurately scored responses to sentence
stimuli, but as their stimuli were uncalibrated, SRTs could not be compared with those
obtained with tester scoring. Speech recognizers are sometimes “trained” on the speech
characteristics of the speaker, a process that was not employed in our project due
to time constraints. Incorporating this training into the method and the improvements
in speech recognizers over the past 10 years may result in more accurate scoring.
In another approach, speech stimuli are presented in a closed-set paradigm with the
listener selecting the alternative that matches the stimulus. Black (1957)[6] and House et al (1965)[7] developed lists of monosyllabic words with multiple response alternatives from which
the listener selected a response from a paper scoresheet to obtain the percent correct.
Dewyer et al (2018)[8] compared open-set word-recognition scores obtained in a clinic setting with closed-set
scores obtained with a cell phone app that presented words through Apple EarPods.
There was a high correlation between the scores obtained by the two methods in spite
of the absence of calibration of the iPhone system. As demonstrated by McCullough
et al (1992; 1994)[9]
[10] that approach is easily automated, replacing the scoresheet with a touchscreen and
automating the scoring with software. A speech-recognition test using this approach
is described in this report.
Closed-set methods produce word-recognition scores that are substantially different
from open-set scores. There are two sources of these differences, one methodological
and one cognitive.[11] First, chance performance is determined by the number of response alternatives.
In an open-set paradigm, the number of alternatives is the listener's entire lexicon
and a 0% score is possible. The theoretical minimum score in a closed-set, four-interval
paradigm such as the one used in this study is 25% and the distribution of scores
is significantly compressed relative to the open-set condition. Second, the difficulty
of a word-recognition task is influenced by lexical competition, the difficulty of
discriminating between similar alternatives. In a closed-set task, lexical competition
can be increased by using alternatives that are similar to the target word, such as
rhyming words. As the number of alternatives and lexical competition increase in a
closed-set task, performance approaches that of open-set recognition. Due to large
differences in the distributions of scores from the two paradigms, different interpretation
guidelines are necessary. In this study, distributions of recognition scores for spondaic
and monosyllabic words presented in a four-interval forced-choice paradigm to young
listeners with normal hearing and listeners with sensorineural hearing loss are reported.
Closed-set scores for monosyllabic words with rhyming and nonrhyming alternatives
were measured to vary the lexical competition of the task.
The specific aims of this project were (1) to develop an automated method for measuring
SRT for spondaic words that produces scores that are in close agreement with average
pure-tone thresholds and (2) to develop an automated test of word recognition that
distinguishes listeners with normal hearing from those with sensorineural hearing
loss and which informs the hearing aid evaluation process.
Methods
Participants
Thirty adults with normal hearing and 20 adults with sensorineural hearing loss participated
in the SRT study. All were native American English speakers. A subset of 10 adults
with normal hearing and 16 of the adults with sensorineural hearing loss participated
in the word-recognition study. The participants with normal hearing were recruited
from the student body of the University of Minnesota, Twin Cities campus with age
ranging from 18 to 30 years. The participants with sensorineural hearing loss were
recruited from the Audiology Clinic of the Fairview-University Medical Center, Minneapolis,
with age ranging from 18 to 79 years. Tympanometry, otoscopy, and bone conduction
testing ruled out external and middle ear disorders. The normal and hearing loss groups
had equal numbers of male and female participants. As test results from two ears of
the same participant are correlated and thus not independent, one ear of each participant
was tested. The right or left ear was randomly selected for the normal group. For
the hearing loss group, the better ear was selected to minimize the need for contralateral
masking. The protocol was approved by the University of Minnesota Institutional Review
Board and all participants signed consent forms.
Pure-Tone Audiometry
All participants were tested with AMTAS.[2] The participants in the normal group had audiometric thresholds that were less than
or equal to 20 dB HL at octave frequencies from 250 to 8,000 Hz. Participants with
hearing loss had a wide range of audiometric severities and patterns and four-frequency
(500, 1,000, 2,000, and 4,000 Hz) pure-tone averages (PTAs) that ranged from 21 to
59 dB HL (mean = 40 dB HL). To facilitate a description of the widely varying audiometric
patterns of the hearing loss group, audiograms were classified with automated method
for classification of audiograms (AMCLASS), a method for classifying audiograms by
severity, configuration, and site of lesion.[12] AMCLASS categories were validated against responses of a panel of expert judges,
who categorized the severity, configuration, and site of lesion of a set of 200 audiograms
with varying patterns. AMCLASS rules were derived that maximize the agreement between
AMCLASS categories and those of the expert judges. A large clinical database of 27,554
audiograms was analyzed[13] and average audiograms were calculated for each configuration category. The average
audiograms are based on the number of cases in the database that fell into the various
categories and ranged from 166 cases for the moderate trough configuration to 4,006
cases for the mild–severe sloping configuration. [Fig. 1] shows average audiograms for the configurations of audiograms of the hearing loss
participants in this study.[13] The audiograms fell into seven severity categories, shown in the legend in the figure
with the number of participants in each category.
 Fig. 1 Average audiograms for participants in each of seven automated method for classification
of audiograms categories. The number of participants in each group is given in the
artwork.
Fig. 1 Average audiograms for participants in each of seven automated method for classification
of audiograms categories. The number of participants in each group is given in the
artwork.
Three methods for calculating PTA from the audiograms were used: three-frequency average
(500, 1,000, and 2,000 Hz); two-frequency average (500 and 1,000 Hz); and Fletcher
rule (average of the lowest two thresholds among 500, 1,000, and 2,000 Hz).[14]
[15]
Word-Recognition List Construction
Spondee List
Thirty-one recorded spondaic words from the Auditec of St. Louis compact disc were
used to measure SRT. From the original list of 36 words,[16] 5 were omitted based on the subjective judgment of the investigators that they are
not in common use (drawbridge, duckpond, hothouse, inkwell, and whitewash). The order
of the words was randomized during the SRT protocol, which is described later.
Monosyllabic Word Lists
The 200, Northwestern University Auditory Test No. 6 (NU-6), consonant-nucleus-consonant
monosyllabic words[17] spoken by a female (VA-1 speaker)[18] served as the pool of words from which 100 words were selected and organized into
four equivalent 25-word lists. Two criteria were used to select the words. First,
each word was required to have at least three other words in common usage (based on
the subjective judgment of the investigators) that rhymed. This was accomplished by
substituting the first letter of each word with the remaining consonants in the alphabet
that produced a sizable list of alternative words that was supplemented with a few
additional words from online sources. Each of the 100 test words was used three times
as a nonrhyming alternative word. Second, the words that were easiest and most difficult
on the recognition task by older listeners with sensorineural hearing loss were excluded.
The database on which this decision was made was compiled at the Bay Pines VA Medical
Center (Table SM11 in the supplemental materials of Wilson & McArdle, 2015)[19] with the VA-1 female speaker recorded version of NU-6 presented monaurally at a
comfortable listening level (30–40 dB above the SRT) to 953 patients (mean age = 69.9
years; mean PTA = 34.9 dB HL) during their audiologic evaluations. This produced several
test scores for the four, 50-word lists that ranged from 187 to 302, which provided
a sufficient sampling of each of the 200 NU-6 words within this older patient population.
A target performance range of 60 to 80% correct for each word was selected with the
final range being 59.1 to 82.4%. Listings of the four, 25-word lists along with percent
correct for each word from the Bay Pines database, the three non-rhyming alternatives
are provided in the Appendix ([Tables A1]–[A4]). All four lists, 100 words in total, were presented at each level in the protocol
described later.
Speech-Recognition Thresholds
Digitized spondee words were delivered by a prototype audiometer[20] to circumaural earphones (Sennheiser HDA200). The audiometer was calibrated to ANSI
S3.6 (2018)[21] specifications for pure-tone and speech stimuli. After each spondee presentation,
the listener viewed a touch screen that displayed four textual spondee words in a
2 × 2 matrix with the position of the presented word randomly placed in one of the
four matrix positions and the listeners touched the word they thought they heard.
The following bracketing procedure was used to determine the SRT. Two spondees were
presented at a starting level of 20 dB re: three-frequency PTA (500, 1,000, and 2,000 Hz).
If an incorrect response occurred, the level was increased in 10-dB steps (to a maximum
of 80 dB HL) with two words presented at each level until both responses were correct.
The level was decreased in 10-dB steps with two words presented at each level until
one or two responses at a given level were incorrect. The level was increased in 5-dB
steps with two words presented at each level until both responses were correct at
a given level. The level was decreased in 5-dB steps with two words presented at each
level until at least one incorrect response occurred at a given level. The level was
increased in 5-dB steps with two words presented at each level until there was an
incorrect response. The SRT was defined as the level in an ascending series at which
both responses were correct.
Word-Recognition Test
Word-recognition scores were obtained for three conditions in the following order:
-
Closed-set rhyming—The listener chose a response from the touchscreen which displayed
the correct response (in random position) and three alternatives that were words that
rhyme with the test word, for example (correct response in caps), SHIRT hurt dirt
skirt.
-
Closed-set nonrhyming—The listener chose a response from the touchscreen which displayed
the correct response (in random position) and three alternatives that were words that
do not rhyme with the test word, for example (correct response in caps), BURN week
young hash.
-
Open set—The listener repeated each word and the tester scored the response as correct
or incorrect.
Words were presented at the following levels. Levels were selected based on pilot
data to capture most of the performance–intensity function, with emphasis on the top
half of the function. All levels are referenced to the PTA calculated by the Fletcher
rule. All 100 test words were presented at each level. Levels were presented in order
from low to high to minimize learning effects.
Normal Group
-
Open set—11, 17, 23, 29, 35, 41 dB re: PTA.
-
Closed set—6, 10, 14, 18, 22, 26 dB re: PTA.
Hearing Loss Group
-
Open set—22, 28, 34, 40, 46 dB re: PTA.
-
Closed set—14, 18, 22, 26, 30 dB re: PTA.
Results and Discussion
Speech-Recognition Threshold
Mean PTA, SRT, and SRT–PTA differences for the two subject groups are shown in [Table 1]. For the normal group, mean SRT was lower than PTA with the Fletcher rule producing
the smallest differences. The means for the three PTA measures were not statistically
different for the normal group (F[2, 87] = 0.55, p = 0.58). The three mean PTA values for the hearing loss group were statistically
different (F[2, 57] = 11.8, p = 0.0001). Post hoc testing indicated that the differences between means were significant
for two-frequency and three-frequency methods and for three-frequency and Fletcher
rule methods and not for two-frequency and Fletcher rule methods at 0.05 confidence
level. SRT was lower than PTA for the three-frequency average but not for the two-frequency
average and Fletcher rule method.
Table 1
Average 3 Freq PTA, 2 Freq PTA, SRT, and differences between SRT and PTA for three
PTA calculation methods
|
PTA
|
SRT
|
SRT − PTA
|
|
3 Freq
|
2 Freq
|
Rule
|
3 Freq
|
2 Freq
|
Rule
|
|
Normal
|
|
Mean
|
2.3
|
1.9
|
1.1
|
−0.8
|
−3.1
|
−2.7
|
−1.9
|
|
SD
|
4.4
|
4.5
|
4.7
|
4.4
|
3.8
|
4.0
|
3.6
|
|
Hearing loss
|
|
Mean
|
31.0
|
24.6
|
24.1
|
24.3
|
−6.7
|
−0.3
|
0.2
|
|
SD
|
12.0
|
12.7
|
13.2
|
13.6
|
5.2
|
3.6
|
4.0
|
Abbreviations: Freq, frequency; PTA, pure-tone average; SD, standard deviation; SRT,
speech-recognition threshold.
Note: 3 Freq = average threshold at 500, 1,000, and 2,000 Hz; 2 Freq = average threshold
at 500 and 1,000 Hz; Rule = average of lowest two thresholds among 500, 1,000, and
2,000 Hz (Fletcher rule).
Distributions of differences between SRT and PTA are shown in [Fig. 2] for the normal group (left panel) and for the hearing loss group (right panel).
The figures show the proportion of differences between SRT and the various PTAs for
each 5-dB interval. For the normal group, the proportion of differences that were
within 5 dB of equality was 87% for two-frequency average, 90% for three-frequency
average, and 93% for the Fletcher rule average. For the hearing loss group, the proportion
of differences that were within 5 dB of equality was 100% for two-frequency average,
65% for three-frequency average, and 95% for the Fletcher rule method.
 Fig. 2 SRT–PTA differences for normal participants (left panel) and hearing loss participants
(right panel) for two-frequency PTA (500 and 1,000 Hz) and three-frequency PTA (500,
1,000, and 2,000 Hz) and the Fletcher rule. PTA, pure-tone average; SRT, speech-recognition
threshold.
Fig. 2 SRT–PTA differences for normal participants (left panel) and hearing loss participants
(right panel) for two-frequency PTA (500 and 1,000 Hz) and three-frequency PTA (500,
1,000, and 2,000 Hz) and the Fletcher rule. PTA, pure-tone average; SRT, speech-recognition
threshold.
Several reports have derived formulas by regression analysis that predict the SRT
by weighted averages of pure-tone thresholds at various combinations of frequencies.[14]
[15]
[22]
[23]
[24]. Fletcher[14]
[15] suggested that the average of the lowest two thresholds among 500, 1,000, and 2,000 Hz
provides good agreement with the SRT. Siegenthaler and Strand (1964)[25] and Carhart (1971)[26] examined various formulas and concluded that a two-frequency average (500 and 1,000 Hz)
provided good agreement with SRT. More complicated formulas with weighted averages
at more frequencies provided only slight improvement. Carhart (1971)[26] recommended the two-frequency average with a correction factor of −2 dB. In the
current study, the Fletcher rule of using the two lowest thresholds did not provide
significantly better agreement with the SRT than the two-frequency average. The results
indicate that the automated forced-choice procedure produces PTA–SRT differences that
agree closely with results of studies that obtained SRT with the commonly used open-set
method.
Word-Recognition Scores
Mean word-recognition scores for the normal group are shown in [Fig. 3] with comparison data from Wilson and Antablin (1980)[27] and Wilson et al (1990).[28] Closed-set scores with nonrhyming alternatives are higher than those with rhyming
alternatives due to the greater lexical competition of the rhyming alternatives.[11] This is consistent with the observation by Wilson and Antablin (1982)[29] that closed-set word-recognition performance decreases as the similarity of the
response alternatives increases. Analysis of variance for the closed-set scores indicated
that the effects of level (F[1, 5] = 29.9, p = 0.001) and condition (rhyming vs. nonrhyming) (F[1, 10) = 13.6, p = 0.01) are statistically significant. The closed-set rhyming scores are slightly
lower than those reported by Wilson and Antablin (1980)[27] for 24 normal hearing participants using similar, but not identical, stimuli. Open-set
scores were compared with the results of the Wilson et al (1990)[28] study that tested 24 participants with normal hearing with similar stimuli. Their
results were referenced to dB SPL. The comparison in [Fig. 3] is based on an assumption of an average PTA of 5 dB HL for the listeners in the
Wilson et al's (1990)[28] study. The slopes of the two functions at 50% point are identical (4.3%/dB).
 Fig. 3 Mean word-recognition scores for the normal group for open-set and closed-set paradigms.
The closed-set paradigms utilized rhyming and nonrhyming alternatives. Vertical lines
are 1 SD for the data in the current study. Data from Wilson et al (1990)[28] and Wilson and Antablin (1980)[27] are shown for comparison. SD, standard deviation.
Fig. 3 Mean word-recognition scores for the normal group for open-set and closed-set paradigms.
The closed-set paradigms utilized rhyming and nonrhyming alternatives. Vertical lines
are 1 SD for the data in the current study. Data from Wilson et al (1990)[28] and Wilson and Antablin (1980)[27] are shown for comparison. SD, standard deviation.
Individual word-recognition scores for the rhyming closed-set condition for the hearing
loss group are shown in [Fig. 4]. The bold lines represent the normal range defined by the means for the normal group ± 2
standard deviation (SD) with a maximum of 100%. Scores for the hearing loss group
varied widely. Some were within the normal range at all levels (e.g., S5 and S14);
some were outside the normal range at all levels (e.g., S19 and S20); some were within
the normal range at low levels and fell outside the normal range at higher levels
(e.g., S16 and S17).
 Fig. 4 Closed-set word-recognition scores (rhyming alternatives) for 16 participants with
sensorineural hearing loss. The bold lines are the normal range (mean score of normal
group + 2 SD with a maximum of 100%). PTA, pure-tone average; SD, standard deviation.
Fig. 4 Closed-set word-recognition scores (rhyming alternatives) for 16 participants with
sensorineural hearing loss. The bold lines are the normal range (mean score of normal
group + 2 SD with a maximum of 100%). PTA, pure-tone average; SD, standard deviation.
Individual open-set word-recognition scores for hearing loss listeners are shown in
[Fig. 5]. The bold lines represent the normal range defined by the means for the normal group ± 2
SD. Similar to the closed-set data, about half of the hearing loss group fell within
the normal range.
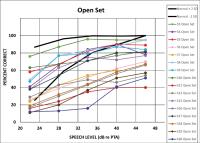 Fig. 5 Open-set word-recognition scores for 16 participants with sensorineural hearing loss.
The bold lines are the normal range (mean score of normal group + 2 SD with a maximum
of 100%). PTA, pure-tone average; SD, standard deviation.
Fig. 5 Open-set word-recognition scores for 16 participants with sensorineural hearing loss.
The bold lines are the normal range (mean score of normal group + 2 SD with a maximum
of 100%). PTA, pure-tone average; SD, standard deviation.
[Fig. 6] shows the relationship between closed-set and open-set scores for the hearing loss
participants averaged across all presentation levels. Although the range of closed-set
scores is substantially compressed relative to the open-set scores, the high correlation
(0.87) suggests that the two methods measure similar auditory processes.
 Fig. 6 Closed-set (rhyming alternatives) versus open-set word-recognition scores for hearing
loss listeners. Each datum point is the closed-set score averaged for all presentation
levels plotted against the mean open-set score for an individual subject.
Fig. 6 Closed-set (rhyming alternatives) versus open-set word-recognition scores for hearing
loss listeners. Each datum point is the closed-set score averaged for all presentation
levels plotted against the mean open-set score for an individual subject.
The possibility that participants who fell within an AMCLASS group would show less
variability than the group as a whole was explored by examining scores within groups.
[Fig. 7] shows individual scores for participants with normal-to-moderate sloping hearing
loss. It is clear that the audiometric pattern does not account for the wide variability
of the speech-recognition results. Similarly, age does not account for the variability.
The age range of the participants with normal-to-moderate sloping hearing loss was
46 to 72 years. The correlation between age and average open-set score across all
presentation levels score was −0.07.
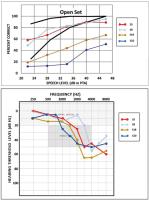 Fig. 7 Open-set word-recognition scores for four participants with normal-to-moderate sloping
sensorineural hearing loss. The bold lines are the normal range (mean score of normal
group + 2 SD with a maximum of 100%). Audiograms for the four participants are shown
in the bottom panel. PTA, pure-tone average; SD, standard deviation.
Fig. 7 Open-set word-recognition scores for four participants with normal-to-moderate sloping
sensorineural hearing loss. The bold lines are the normal range (mean score of normal
group + 2 SD with a maximum of 100%). Audiograms for the four participants are shown
in the bottom panel. PTA, pure-tone average; SD, standard deviation.
Substantial differences in open-set and closed-set scores were observed for recognition
of monosyllabic words for normal ([Fig. 3]) and hearing loss ([Figs. 5] and [7]) listeners. Closed-set testing compressed the range of scores relative to open-set
testing. In a closed-set four-interval forced-choice test, average minimum correct
rate (i.e., when the stimulus is not audible) is expected to be 25%, whereas for open-set
testing, a minimum score of 0% is possible. This accounts for the large differences
in the distributions, shown in [Figs. 5] and [6].
The wide range of variability for the open-set scores of the hearing loss group shown
in [Fig. 5] is striking. The scores in [Fig. 5] are similar to open-set results with the same speech materials reported by Wilson
(2011)[30] and to scores obtained with word lists that were similarly constructed reported
by Margolis and Millin (1971).[31] In general, the scores are lower than those obtained with recordings of a male speaker.
To further compare word-recognition scores for the hearing loss participants obtained
with male and female speakers, scores from clinical evaluations (male speaker) were
compared with scores obtained in this study (female speaker). The clinic tests were
performed with the Q/MASS recordings of NU-6 words by a male speaker.[32] For this comparison, participants were selected when there were clinic tests performed
at levels within 3 dB of a level used in this study. [Fig. 8] shows the open-set scores for those participants along with the clinic scores. The
scores obtained with recordings made by a female speaker are substantially lower and
more variable than those obtained with the male-speaker recordings.
 Fig. 8 Open-set word-recognition scores for the hearing loss participants obtained with
two sets of recordings of NU-6 monosyllabic words. The clinic scores were obtained
in a clinical hearing evaluation using the Q/MASS recordings of male speech. The AMTEST
scores were those obtained in this study with VA recordings of female speech. Error
bars are +1 standard deviation.
Fig. 8 Open-set word-recognition scores for the hearing loss participants obtained with
two sets of recordings of NU-6 monosyllabic words. The clinic scores were obtained
in a clinical hearing evaluation using the Q/MASS recordings of male speech. The AMTEST
scores were those obtained in this study with VA recordings of female speech. Error
bars are +1 standard deviation.
The results in [Fig. 7] for hearing loss listeners with normal-to-moderate sloping hearing losses suggest
that neither audibility nor age accounts for the wide range of variability. To further
explore the relationship between word-recognition scores and audibility, correlation
coefficients were calculated between average open-set word-recognition scores at all
presentation levels and PTAs and between word-recognition scores and thresholds at
individual frequencies. These are shown in [Fig. 9]. The correlation between average open-set word-recognition score and PTAs increased
substantially as more high-frequency thresholds were included in the average. The
correlations with pure-tone thresholds progressed from −0.03 at 500 Hz to −0.24 at
1,000 Hz to −0.73 at 2,000 Hz and then decreased slightly to −0.67 at 4,000 Hz. The
decrease at 4,000 Hz is consistent with the lower importance of that frequency relative
to 2,000 Hz for recognition of monosyllabic words.[33] Taken together, the data in [Figs. 8] and [9] show evidence of the contributions of both the distortion component and the attenuation
component of hearing loss discussed by Plomp (1978),[34] referred to by Carhart (1951)[35] as the acuity component and clarity component.
 Fig. 9 Pearson's product-moment correlation coefficients between average open-set word-recognition
score and pure-tone averages (2 Fr = 500, 1,000 Hz; 3 Fr = 500, 1,000, 2,000 Hz; 4
Fr = 500, 1,000, 2,000, 4,000 Hz) and between average open-set word-recognition score
and thresholds at 1,000, 2,000, and 4,000 Hz.
Fig. 9 Pearson's product-moment correlation coefficients between average open-set word-recognition
score and pure-tone averages (2 Fr = 500, 1,000 Hz; 3 Fr = 500, 1,000, 2,000 Hz; 4
Fr = 500, 1,000, 2,000, 4,000 Hz) and between average open-set word-recognition score
and thresholds at 1,000, 2,000, and 4,000 Hz.
The closed-set scores in [Fig. 4] indicate that most of the scores of hearing loss listeners are in the normal range
at low levels and most are outside the normal range at high levels. The results indicate
that, as a group, the hearing loss listeners have significant deficits in recognition
of monosyllabic words presented in quiet. The results challenge the widely held notion
that listeners with sensorineural hearing loss have little difficulty in quiet but
speech recognition in noise brings out the deficits that produce speech communication
difficulties.
A Clinical Protocol
A clinical protocol should be based on the information that is desired from a test
and rules for how the information is to be interpreted. A clinical protocol has been
designed for an automated closed-set speech-recognition test that addresses two questions.
-
Is the listener's speech-recognition performance in the normal range?
-
Does an increase in speech level result in improved performance?
The protocol differs from the usual practice of obtaining a score at a high level
to determine maximal performance (“PB-max”).
To address the first question, ideally, scores would be obtained at a wide range of
presentation levels. This is not feasible in a clinical regimen. The proposed protocol
examines the score at 22 dB re: two-frequency PTA. At this level, hearing loss listeners
in our sample whose scores were in the normal range had scores in the normal range
at all levels ([Fig. 4]). Hearing loss listeners whose scores were outside the normal range had scores outside
the normal range at all higher levels. For our sample, the test performed at 22 dB
re: two-frequency PTA effectively separates listeners with normal hearing from listeners
with sensorineural hearing loss.
The second question may provide information that is useful for evaluating hearing
aid candidacy and for predicting hearing aid success. The protocol calls for testing
at a second level (30 dB re: PTA) if the first score is outside the normal range.
If the score does not increase at the second level, hearing aid success may be limited
and a high gain setting may be inadvisable. In those cases, other rehabilitative methods,
such as auditory training and communication strategies, should be considered.
[Fig. 10] shows results of this clinical protocol for all the hearing loss participants. The
normal range, defined as the mean ± 2 SD (with a maximum of 100%), is shown by the
dashed lines. These plots illustrate the position of the score relative to normal
and the effect of increasing the stimulus level. In some cases, the procedure may
not capture the maximum score that would be obtained at a higher level. A test could
be performed at a third level to obtain the maximum score. Further evaluation of this
clinical protocol is needed to evaluate its diagnostic utility and value in the hearing
aid selection process.
 Fig. 10 Closed-set (rhyming alternatives) word-recognition scores (solid lines) for monosyllabic
words presented at 22 and 30 dB (re: PTA) for 16 participants with sensorineural hearing
loss. The dashed lines show the normal range. The age (years) is shown in the lower
left corner of each panel.
Fig. 10 Closed-set (rhyming alternatives) word-recognition scores (solid lines) for monosyllabic
words presented at 22 and 30 dB (re: PTA) for 16 participants with sensorineural hearing
loss. The dashed lines show the normal range. The age (years) is shown in the lower
left corner of each panel.
Limitations
The materials reported here were validated on listeners who are native American English
speakers. The forced-choice method requires a level of literacy that permits identification
of written words. Words were presented in the absence of background noise and the
tests have not been validated for speech in noise conditions.
Conclusion
The automated forced-choice SRT procedure described in this report produces threshold
values that are in close agreement with PTAs. The Fletcher rule PTA (average of best
two thresholds among 500, 1,000, and 2,000 Hz) provided the best agreement for hearing
loss participants.
The forced-choice word-recognition test resulted in distinct separation of scores
from the normal and hearing loss groups. A clinical protocol was designed that provides
information about deviations from normal scores and the possible benefits of increasing
the presentation level.


