Keywords
adrenoleukodystrophy - Loes score - magnetic resonance imaging - very long chain fatty
acids
Introduction
X-linked adrenoleukodystrophy (X-ALD) is a common peroxisomal disorder with a wide
spectrum of clinical manifestations and classic imaging findings. The disease (#OMIM
300100) is secondary to mutations in the ATP binding cassette subfamily D member 1
(ABCD1) gene[1] that is responsible for β-oxidation of very long chain fatty acids (VLCFAs) in multiple
tissues like the adrenal gland, central nervous system myelin, and Leydig cells of
the testicles. The commonest phenotype of X-ALD is childhood cerebral adrenoleukodystrophy
(CCALD) that presents between 4 and 10 years of age. Other types include late onset
cerebral forms (CALD), adrenomyeloneuropathy, and Addison only presentation. The life-time
risk of patients with mutation in the ABCD1 gene to develop CCALD is ~60% and usually occurs between 5 and 12 years of age.[2]
The typical neuroimaging findings of deep white matter involvement in the parieto-occipital
lobes and splenium of the corpus callosum generally prompt further confirmatory testing.
Analysis of VLCFAs profile on dried blood spots is a good sensitive biomarker for
X-ALD but not specific and hence requires molecular confirmation. However, one cannot
underestimate the importance of neuroimaging as a screening and diagnostic tool especially
in the presymptomatic stage where both behavior and cognition are normal. In cases
where the involvement of the central nervous system is detected earlier, hematopoietic
stem cell transplantation (HSCT) can be a best option to arrest the disease progression.
Even in situations where an appropriate donor is unavailable, role of gene therapy
is currently being investigated to halt the disease process.[3] Hence, it is important to detect this disease as early as possible as these therapies
can only be effective during a short therapeutic window. This knowledge has also largely
driven the implementation of newborn screening for X-ALD across some countries in
the globe.[4]
Loes in 1994 developed an imaging-based scoring system for patients with X-ALD based
on the neuroanatomical involvement and the presence or absence of total and/or global
atrophy. This 34-point imaging-based severity scale was based on the location and
extent of central nervous system involvement and presence of either focal or global
atrophy.[5] The score thus obtained helps in the prediction of disease course and selection
of patients for HSCT. Reports on the clinical and imaging spectrum of patients with
X-ALD from the Indian subcontinent are sparse. We hereby discuss the clinical and
neuroimaging findings from 22 individuals with CCALD and CALD subtype of X-ALD seen
at our center.
Subjects and Methods
The study was approved by the Institutional Ethical Committee for research on human
subjects. Nineteen individuals presenting with symptoms suggestive of CCALD or CALD
forms of X-ALD and three asymptomatic individuals who were identified on cascade screening
of the male siblings of the family in question at the time of presentation were evaluated
during the study period (2016–2020). Clinical and neurological evaluation was performed
in all patients. The parameters noted were age at manifestation of first symptom,
age at presentation to the clinic, features suggesting adrenal dysfunction including
presence of hyperpigmentation, neuroregression, seizures, sensory and behavioral disturbances,
muscle weakness, difficulty in walking and visual, and hearing loss. Progression of
symptoms in the affected individuals and onset of symptoms in asymptomatic siblings
were monitored by 3 monthly follow-up.
Biochemical analysis was done on dried blood spots using Neobase kit 2.0 on an ABI
3200MD QTrap LCMSMS systems using flow injection technique. Primary metabolite assessed
was lysophosphatidylcholine C26:0 (cutoff: 0.604 μmol/3.2 mm punch). The confirmation
of the diagnosis was made by sequencing the ABCD1 gene using a 24 capillary sequencer (ABI 3500xL). If sequencing did not identify
a mutation, multiplex ligation-dependent probe amplification was performed for detecting
deletions/duplications if any. For novel variants, bioinformatics analysis was performed
using Polyphen, sorting tolerant from intolerant (SIFT), Mutation taster softwares
and segregation studies were also performed to confirm the pathogenicity. Only those
fulfilling the biochemical and molecular criteria were further assessed.
Magnetic resonance imaging (MRI) was obtained on a 3 tesla (Siemens, Munich, Germany;
General Electric Medical Systems, Milwaukee, Wisconsin, United States; Philips Medical
Systems, Cleveland, Ohio, United States) and for few MRIs that were performed outside
the institute; images were obtained in a CD-ROM in DICOM format and reviewed by the
single neuroradiologist to ensure no observer bias. The scoring system was obtained
from the study by Loes et al[5] with the assessment of abnormalities on T2-weighted, T1-weighted, and postcontrast
images. Advanced neuroimaging parameters such as diffusion tensor imaging (DTI) or
single voxel magnetic resonance spectroscopy were not available for majority of the
patients and hence were not analyzed. Supratentorial white matter including corpus
callosum and visual pathway, frontopontine and brain stem projection fibers, corticospinal
tract, cerebellum, and basal ganglia regions were assessed for disease involvement.
White matter was divided into three territories: anterior temporal, frontal, and parieto-occipital
white matter (which includes the posterior temporal white matter lying posterior to
the anterior margin of midbrain). The supratentorial white matter was also divided
into periventricular, central, and subcortical divisions. These divisions were defined
as being approximately equal in thickness to cortical gray matter. If involvement
was unilateral for a specific location, a score of 0.5 was given. If involvement was
doubtful for a specific location without evidence of any other abnormality, a score
of 0.5 was given. Higher scores represent severe involvement of white matter. In our
study, the presence of a brain lesion was given a Loes score of ≥ 0.5. Focal atrophy
was identified by a qualitative loss of brain parenchyma and global atrophy was assessed
by both quantitative and qualitative measure. A scoring of one point was given for
prominent subarachnoid space and the diameter of third ventricle between 5 and 10
mm. Two points were allocated if the diameter of third ventricle was >10 mm. One point
was allocated if the bifrontal horn to inner table ratio was more than 40%. A ratio
of more than 50% was given 2 points and a maximum of 3 points were given for higher
ratios. Following calculation of Loes score, patients were grouped into multiple categories
based on the severity of scores (4, 5–10 >10). These categories were chosen as patients
with scores <9 respond better to HSCT[6] and early inclusion of individuals with score ≤4 for HSCT was recently proposed.
Postcontrast sequences when available were analyzed for the presence of contrast enhancement
of the lesions. Whenever present, the pattern of contrast enhancement was also recorded.
Diffusion-weighted images (DWI) when available were analyzed and the findings were
recorded. All these measurements were taken at a single time frame except in two familial
cases, where HSCT was envisaged and the images were obtained twice at an interval
of 9 and 12 months prior to the decision for HSCT. The summary of MRI severity scale
proposed by Loes in presented in [Table 1].
Table 1
MRI severity scale scoring (Loes et al[5])
|
Abbreviation: MRI, magnetic resonance imaging.
Each region is given a score of 0 for normal, 0.5 for unilateral involvement, and
1 for bilateral involvement or atrophy. The maximum score is 34.
|
|
Parieto-occipital white matter (maximum 4)
|
Basal ganglia (maximum 1)
|
|
Anterior temporal white matter (maximum 4)
|
|
Frontal white matter (maximum 4)
-
Periventricular
-
Central
-
Subcortical
-
Local atrophy
|
Visual pathway (maximum 4)
-
Optic radiation
-
Meyer’s loop
-
Lateral geniculate body
-
Optic tract
|
|
Corpus callosum (maximum 5)
-
Splenium
-
Genu
-
Body
-
Splenium atrophy
-
Genu atrophy
|
Auditory pathway (maximum 4)
|
|
Global atrophy (maximum 4)
-
Mild
-
Moderate
-
Severe
-
Brainstem
|
Cerebellum (maximum 2)
|
|
Projection fibers (maximum 2)
-
Internal capsule
-
Brain stem
|
Statistical analysis: Stata 11 software analysis was employed. Data on various outcome
variables were presented as mean and standard deviation. Percentages were used wherever
applicable.
Results
During the 5-year period (2016–2020), 22 cases from 19 families with a clinical and
radiological phenotype suggestive of CCALD and late onset CALD forms of X-ALD were
assessed. Among them, 10 had CCALD phenotype, 9 had CALD phenotype, and 3 individuals
from 3 unrelated families were asymptomatic and were identified from cascade screening.
Consanguinity was present in a single family. All of them had molecular confirmation
of the diagnosis along with elevated VLCFA and C26:0 levels and significant findings
on MRI.
The mean age of presentation of CCALD was 7.5 years (standard deviation [SD]: 1.8)
and of CALD was 11.3 years (SD: 1.5). The clinical features of symptomatic individuals
are depicted in [Table 2]. Visual difficulty and muscular weakness were the most common symptoms (58%). All
symptomatic individuals had classic MRI picture of X-ALD in the form of hyperintensities
involving the parieto-occipital area and splenium of corpus callosum. The other common
areas of involvement were the visual and auditory pathway (n = 17 [89.5%] and n = 12 [63%]), respectively. Involvement of projection fibers of brain stem was observed
in 13 symptomatic individuals (68.4%) and that of frontotemporal area in 9 individuals
(47.3%). Global atrophy that was observed in 10 individuals (52.6%) also had onset
of disease in early childhood indicating the rapid progression of the disease ([Table 3]).
Table 2
Clinical features of 19 symptomatic individuals
|
Clinical symptoms
|
No of affected individuals (%)
|
|
Vision loss
|
11 (58)
|
|
Hearing loss
|
8 (42)
|
|
Seizures
|
3 (16)
|
|
Headache
|
6 (32)
|
|
Behavioral abnormality
|
6 (32)
|
|
Neuroregression
|
8 (42)
|
|
Gait abnormality
|
9 (47)
|
|
Bowel and bladder abnormality
|
2 (11)
|
|
Muscle weakness
|
11 (58)
|
Table 3
MRI findings of symptomatic and asymptomatic individuals
|
White matter involvement: parieto-occipital white matter
|
Disease presentation (no. of individuals)
|
|
Symptomatic
|
Asymptomatic
|
Total
|
|
Abbreviation: MRI, magnetic resonance imaging.
|
|
Normal
|
0
|
2
|
2
|
|
Abnormal
|
19
|
1
|
20
|
|
White matter involvement:
frontotemporal white matter
|
Disease presentation
|
|
Symptomatic
|
Asymptomatic
|
Total
|
|
Normal
|
10
|
3
|
13
|
|
Abnormal
|
9
|
0
|
9
|
|
Corpus callosum: splenium
|
Disease presentation
|
|
Symptomatic
|
Asymptomatic
|
Total
|
|
Normal
|
0
|
1
|
1
|
|
Abnormal
|
19
|
2
|
21
|
|
Corpus callosum: genu
|
Disease presentation
|
|
Symptomatic
|
Asymptomatic
|
Total
|
|
Normal
|
15
|
3
|
18
|
|
Abnormal
|
4
|
0
|
4
|
|
Corpus callosum: body
|
Disease presentation
|
|
Symptomatic
|
Asymptomatic
|
Total
|
|
Normal
|
17
|
3
|
20
|
|
Abnormal
|
2
|
0
|
2
|
|
Projection fibers: internal capsule
|
Disease presentation
|
|
Symptomatic
|
Asymptomatic
|
Total
|
|
Normal
|
12
|
3
|
15
|
|
Abnormal
|
7
|
0
|
7
|
|
Projection fibers: brain stem
|
Disease presentation
|
|
Symptomatic
|
Asymptomatic
|
Total
|
|
Normal
|
6
|
2
|
8
|
|
Abnormal
|
13
|
1
|
14
|
|
Cerebellum: white matter
|
Disease presentation
|
|
Symptomatic
|
Asymptomatic
|
Total
|
|
Normal
|
17
|
3
|
20
|
|
Abnormal
|
2
|
0
|
2
|
|
Cerebellum: atrophy
|
Disease presentation
|
|
Symptomatic
|
Asymptomatic
|
Total
|
|
Absent
|
15
|
3
|
18
|
|
Present
|
4
|
0
|
4
|
|
Basal ganglia
|
Disease presentation
|
|
Symptomatic
|
Asymptomatic
|
Total
|
|
Normal
|
14
|
3
|
17
|
|
Abnormal
|
5
|
0
|
5
|
|
Global atrophy
|
Disease presentation
|
|
Symptomatic
|
Asymptomatic
|
Total
|
|
Absent
|
9
|
3
|
12
|
|
Present
|
10
|
0
|
10
|
|
Auditory pathway
|
Disease presentation
|
|
Symptomatic
|
Asymptomatic
|
Total
|
|
Normal
|
7
|
3
|
10
|
|
Abnormal
|
12
|
0
|
12
|
|
Visual pathway
|
Disease presentation
|
|
Symptomatic
|
Asymptomatic
|
Total
|
|
Normal
|
2
|
1
|
3
|
|
Abnormal
|
17
|
2
|
19
|
Loes severity score was calculated for each of these patients. The mean Loes score
of symptomatic individuals was 13.7 (minimum score: 5, maximum score: 30). [Figs. 1]
[2]
[3] show representative MRIs of symptomatic and asymptomatic subjects with Loes score
calculation. It was evident that asymptomatic individuals also had characteristic
changes in MRI brain. While demyelination in the parieto-occipital region was observed
in all three individuals, involvement of splenium of corpus callosum and visual pathway
was observed in two of them and projection fibers of brain stem was involved in one
subject. Two of these asymptomatic individuals had an initial Loes score of 0 and
1, but on follow-up after 6 and 9 months were found to have progression of lesions
with Loes scores of 1 and 2. Even the third individual with a higher Loes score (score
of 9) ([Fig. 3]) did not show any clinical symptoms. Loes score was also categorized based on severity
into three groups–≤4, 5–10, >10 and a comparison was made among CCALD, CALD, and asymptomatic
groups ([Table 4]).
Table 4
Predicted Loes score between symptomatic and asymptomatic individuals (n = 22)
|
Predicted Loes score
|
Disease presentation
|
|
CCALD
(n = 10)
|
CALD
(n = 9)
|
Asymptomatic
(n = 3)
|
Total
(%)
|
|
Abbreviations: CALD, cerebral adrenoleukodystrophy; CCALD, childhood cerebral adrenoleukodystrophy.
|
|
≤4
|
0
|
0
|
3
|
3 (13.6)
|
|
5–10
|
8
|
5
|
0
|
13 (59.1)
|
|
>10
|
2
|
4
|
0
|
6 (27.3)
|
 Fig. 1 Fluid-attenuated inversion recovery images of a 14-year-old symptomatic male: (A) Hyperintensity involving B/L parieto-occipital white matter (thin arrow) and splenium
of corpus callosum (thick arrow); score—4. (B) Involvement of B/L lateral geniculate bodies (thin arrow), optic radiations (thick
arrow), and B/L internal capsule (arrowhead); score—4. (C) Involvement of the body of corpus callosum (arrow); score—1. (D) Involvement of the white matter of B/L anterior temporal lobes (arrow) with atrophy
of B/L temporal lobes (arrowhead); score—3. Total Loes score—12.
Fig. 1 Fluid-attenuated inversion recovery images of a 14-year-old symptomatic male: (A) Hyperintensity involving B/L parieto-occipital white matter (thin arrow) and splenium
of corpus callosum (thick arrow); score—4. (B) Involvement of B/L lateral geniculate bodies (thin arrow), optic radiations (thick
arrow), and B/L internal capsule (arrowhead); score—4. (C) Involvement of the body of corpus callosum (arrow); score—1. (D) Involvement of the white matter of B/L anterior temporal lobes (arrow) with atrophy
of B/L temporal lobes (arrowhead); score—3. Total Loes score—12.
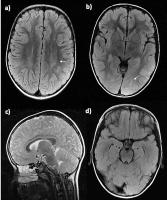 Fig. 2 Magnetic resonance images of a 8-year-old asymptomatic male: (A) Hyperintensity involving B/L parieto-occipital white matter (periventricular) on
axial fluid-attenuated inversion recovery (FLAIR) images; score—1. (B) Foci of FLAIR hyperintensities involving the central part of B/L parieto-occipital
white matter (arrow); score—1. Sagittal T2 image (C) reveals normal corpus callosum. Axial FLAIR image at the level of brain stem (D) appears normal. Total Loes score—2
Fig. 2 Magnetic resonance images of a 8-year-old asymptomatic male: (A) Hyperintensity involving B/L parieto-occipital white matter (periventricular) on
axial fluid-attenuated inversion recovery (FLAIR) images; score—1. (B) Foci of FLAIR hyperintensities involving the central part of B/L parieto-occipital
white matter (arrow); score—1. Sagittal T2 image (C) reveals normal corpus callosum. Axial FLAIR image at the level of brain stem (D) appears normal. Total Loes score—2
 Fig. 3 Magnetic resonance images of a 9-year-old asymptomatic male: (A) T2 hyperintensity involving B/L parieto-occipital white matter (arrow), splenium
(thick arrow) and genu (arrowhead) of corpus callosum; score—4. (B) T2 hyperintensity involving B/L optic pathways (arrow); score—2. T2 hyperintensities
involving the brain stem (arrow in C) and pons (arrow in D); score—2. Involvement of B/L medial geniculate bodies (not shown in the images);
score—1. Total Loes score—9.
Fig. 3 Magnetic resonance images of a 9-year-old asymptomatic male: (A) T2 hyperintensity involving B/L parieto-occipital white matter (arrow), splenium
(thick arrow) and genu (arrowhead) of corpus callosum; score—4. (B) T2 hyperintensity involving B/L optic pathways (arrow); score—2. T2 hyperintensities
involving the brain stem (arrow in C) and pons (arrow in D); score—2. Involvement of B/L medial geniculate bodies (not shown in the images);
score—1. Total Loes score—9.
Discussion
Approximately 60% of patients presenting with any form of X-ALD will eventually develop
inflammatory form of cerebral disease.[2] Prompt recognition of early cerebral involvement can facilitate timely intervention
such as HSCT and this can have significant prognostic implications by arresting and
interrupting the demyelination process.[7] Neuroimaging can thus play a key role in early identification and decision making
pertinent to treatment.
MRI signal changes in X-ALD occur due to inflammation and demyelination. The earliest
T2 sequence abnormality is thought to be due to myelin membrane instability and oxidative
stress that in turn triggers the initial damage that occurs in CALD. The contrast
enhancement seen at later stages may be due to endothelial dysfunction as ABCD1 is
thought to play a role in maintenance of tight junction.[8] Histopathologically, X-ALD is composed of three zones (Schaumburg zones): inner
zone depicts irreversible gliosis and scarring, intermediate zone with active demyelination,
and peripheral zone with active destruction.[9]
Typical neuroimaging findings of CCALD include confluent, symmetrical areas of T2
hyperintensity originating in the parieto-occipital periventricular white matter with
early involvement of splenium of the corpus callosum and progresses in a posterior
to anterior direction.[10] The inner zone appears hypointense on T1W and markedly hyperintense on T2W, intermediate
zone appears iso to hypointense on T2W MRI with postcontrast enhancement, and peripheral
zone appears mildly hyperintense on T2W MRI with no enhancement ([Fig. 4]). Postcontrast enhancement thereby indicates an advancing edge of active inflammation.
In our series, we observed the classic picture of posterior predominance including
the splenium of corpus callosum and parieto-occipital region in all the affected individuals.
Consistent with prior reports, we observed that majority of these lesions in the brain
originated in the midline of the corpus callosum, especially the splenium (100%).[11]
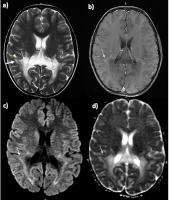 Fig. 4 Magnetic resonance images of a 12-year-old symptomatic male. (A) T2 image: Hyperintensity involving B/L parieto-occipital white matter and splenium
of corpus callosum. Inner zone (thin white arrow) and peripheral zone (thick white
arrow) are hyperintense. Intermediate zone (arrowhead) is isointense. (B) Postcontrast image: Enhancement (white arrow) of intermediate zone. (C) Diffusion-weighting imaging (DWI): Linear hyperintensity (arrow) in contrast-enhanced
zone. (D) Apparent diffusion coefficient image: Linear hypointensity (white arrow) in areas
of hyperintensity on DWI suggesting diffusion restriction. Total Loes score—14.
Fig. 4 Magnetic resonance images of a 12-year-old symptomatic male. (A) T2 image: Hyperintensity involving B/L parieto-occipital white matter and splenium
of corpus callosum. Inner zone (thin white arrow) and peripheral zone (thick white
arrow) are hyperintense. Intermediate zone (arrowhead) is isointense. (B) Postcontrast image: Enhancement (white arrow) of intermediate zone. (C) Diffusion-weighting imaging (DWI): Linear hyperintensity (arrow) in contrast-enhanced
zone. (D) Apparent diffusion coefficient image: Linear hypointensity (white arrow) in areas
of hyperintensity on DWI suggesting diffusion restriction. Total Loes score—14.
Evaluation of conventional DWI and apparent diffusion coefficient map images will
facilitate the detection of major diffusion abnormalities and identification of myelin
edema in leukodystrophies that further strengthens the understanding of the pathogenesis.
In DWI, the inner zone appears hypointense due to total loss of diffusional anisotropy,
the intermediate inflammatory zone is moderately hyperintense indicating restricted
water diffusion due to low-grade myelin edema and hypercellularity caused by lymphocytic
infiltration ([Figs 4]
[5]–[6]), and the most peripheral demyelinating zone is faintly hyperintense, perhaps due
to T2-shine through.[12] However, when the disease is advanced, the three characteristic zones were not evident
on T2 images as well as DWIs ([Fig. 7]).
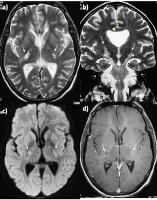 Fig. 5 Magnetic resonance images of a symptomatic male. (A) T2 image: Hyperintensity involving B/L posterior limbs of internal capsule (arrows).
(B) T2 image: Hyperintensity involving B/L corticospinal tracts (arrows). Incidental
cavum septi pellucidi (arrowhead) seen. (C) Diffusion-weighting imaging (DWI): Rim of hyperintensity involving B/L posterior
limbs of internal capsule (arrows). (D) Postcontrast image: Rim of peripheral enhancement (arrows) in areas of hyperintensity
on DWI.
Fig. 5 Magnetic resonance images of a symptomatic male. (A) T2 image: Hyperintensity involving B/L posterior limbs of internal capsule (arrows).
(B) T2 image: Hyperintensity involving B/L corticospinal tracts (arrows). Incidental
cavum septi pellucidi (arrowhead) seen. (C) Diffusion-weighting imaging (DWI): Rim of hyperintensity involving B/L posterior
limbs of internal capsule (arrows). (D) Postcontrast image: Rim of peripheral enhancement (arrows) in areas of hyperintensity
on DWI.
 Fig. 6 Magnetic resonance images of symptomatic male with advanced disease. (A) T2 axial image: Hyperintensity involving B/L frontal and parieto-occipital white
matter (arrows) and B/L internal capsule (arrowhead). (B) T2 sagittal image: Hyperintensity involving the genu, splenium, and part of the
body of corpus callosum (arrows). (C) Diffusion-weighting imaging (DWI): Linear subtle hyperintensity involving subcortical
white matter of B/L occipital lobes (arrows). (D) Apparent diffusion coefficient image: Linear hypointensity (arrows) in areas of
hyperintensity on DWI suggesting diffusion restriction. Total Loes score—22.
Fig. 6 Magnetic resonance images of symptomatic male with advanced disease. (A) T2 axial image: Hyperintensity involving B/L frontal and parieto-occipital white
matter (arrows) and B/L internal capsule (arrowhead). (B) T2 sagittal image: Hyperintensity involving the genu, splenium, and part of the
body of corpus callosum (arrows). (C) Diffusion-weighting imaging (DWI): Linear subtle hyperintensity involving subcortical
white matter of B/L occipital lobes (arrows). (D) Apparent diffusion coefficient image: Linear hypointensity (arrows) in areas of
hyperintensity on DWI suggesting diffusion restriction. Total Loes score—22.
 Fig. 7 Magnetic resonance images of a 14-year-old symptomatic male. (A) T2 image: Hyperintensity involving B/L parieto-occipital white matter (white arrow)
with atrophy. The characteristic three zones of white matter changes are not evident.
(B) Diffusion-weighting imaging (DWI): Linear hyperintensity is not evident in parieto-occipital
white matter. Subtle hyperintensity is seen involving bilateral corona radiata (white
arrow). (C) Apparent diffusion coefficient image: No loss of signal intensity corresponding
to DWI hyperintensity suggesting T2 shine through.
Fig. 7 Magnetic resonance images of a 14-year-old symptomatic male. (A) T2 image: Hyperintensity involving B/L parieto-occipital white matter (white arrow)
with atrophy. The characteristic three zones of white matter changes are not evident.
(B) Diffusion-weighting imaging (DWI): Linear hyperintensity is not evident in parieto-occipital
white matter. Subtle hyperintensity is seen involving bilateral corona radiata (white
arrow). (C) Apparent diffusion coefficient image: No loss of signal intensity corresponding
to DWI hyperintensity suggesting T2 shine through.
Though conventional MRI is highly sensitive to detect white matter abnormalities,
recent modalities like DTI seem to improve the sensitivity and specificity and it
provides a more accurate identification and differentiation of such pathological processes
in a very early stage. The anisotropic water diffusion in nerve fibers is the basis
for the utilization of DTI to establish the nerve fiber pathways and such changes
have been demonstrated in demyelinating diseases.[13] The parameters employed in DTI include fractional anisotropy (FA), mean, radial,
and axial diffusivity (MD, RD, and AD). The contribution to these indices comes from
fiber arrangements, degree of myelination, and axonal integrity. Reduction in white
matter FA reflects changes in tissue connectivity and integrity. Increase in RD and
AD is related to damage in the myelin and axon, respectively. In a study by Ono et
al,[14] DTI parameters exhibited significant changes, despite the unaltered Loes score in
early and very early stages of disease. They proposed that MD and RD measurements
can potentially be used as an adjunct to Loes score in cases with very early stages
of the disease.
Even in the setting of nonavailability of advanced techniques, employment of Loes
score into clinical practice would still help the clinicians in follow-up and decision
making on appropriateness of instituting HSCT. The improvement in survival has increased
from 89 to 95 % as compared with the survival probability of 45 to 54% prior to HSCT.
Peter’s et al suggested the patients with a Loes score <9 may benefit from HSCT[6] and recently the threshold for inclusion of patients for HSCT with a Loes score
of <4 has also been proposed.[15] Reports have also indicated that HSCT when performed in individuals with a high
Loes score (>10) had clinical and radiological progression of the disease.[16] In our series, five individuals (26.3%) had a Loes score of <9 and two unaffected
individuals had a score of <4. These individuals would therefore be ideal candidates
for HSCT.
In India, the current policy of funding of rare diseases through the Rastriya Arogya
Nidhi in the context of the rare disease policy intends one-time funding for HSCT.
This will likely benefit this population who cannot afford such modality of therapy.
Individuals identified by cascade screening can have better outcomes as these individuals
harboring neurological involvement without symptoms can be identified earlier and
enrolled for treatment. Two of our asymptomatic individuals had a Loes score of <4
and are hence definite beneficiaries of the Rastriya Arogya Nidhi Scheme and efforts
are being pursued for the same.[17]
The limitations of our study were that the neuropsychological tests that include evaluation
of intelligence quotient (IQ) (full-scale IQ, verbal IQ, and performance IQ), five
major cognitive domains (language, visuospatial skills, perception, visuomotor, or
graphomotor skills, memory and attention or executive function), and adaptive skills
were not assessed quantitatively. Hence, the categorization of asymptomatic individuals
may not be genuinely representative. Also, serial MRIs in context of follow-up as
designated were not performed due to issues in sedation and financial constraints.
Though all scans were reviewed by a single radiologist, uniform MRI brain sections
were not available. The subtle decrease in performance observed within some of the
cognitive functional domains owing to axonal structural abnormalities may not be visible
on conventional MRI. Further characterization of lesions using specialized imaging
modalities such as magnetic resonance spectroscopy and DTI was not included in this
analysis.
To conclude, our study represents the clinical and radiological profile for a large
subgroup of individuals with X-ALD from India. We also demonstrated the utility of
calculating the Loes severity score based on MRI. Employment of such scores in clinical
practice would help in follow-up of the disease and in selecting the candidates for
HSCT. This currently remains the only viable option for interrupting the demyelination
process when performed at an early stage of the disease.


