

Subscribe to RSS
DOI: 10.1055/a-2461-3349
Brisk Walking Pace Offsets Venous Thromboembolism Risk Equivalent to Established Monogenic Mutations
Authors
Funding J.H. was supported by the National Key Research and Development Program of China [2022YFC3600800]. J.M.R. is supported by the Alzheimer's Research UK.

Abstract
Background
Mendelian mutations in the Prothrombin gene (F2) and the factor V Leiden gene (F5) genes are established risk factors for venous thromboembolism (VTE). Walking pace is associated with the risk of coronary artery diseases, but no study has investigated its association with VTE. This study aimed to investigate the association and causality between walking pace and VTE, compare its population risk with established Mendelian mutations, and determine if blood biomarkers mediate its effect.
Methods
We followed up 445,261 UK Biobank participants free of VTE at baseline. Self-reported walking pace was collected via touchscreen questionnaire at baseline. The carrier status of two Mendelian mutations in F2 and F5 genes was determined by the genotypes of rs1799963 (G20210A, c.*97 G > A) and rs6025 (p.R534Q), respectively. Cox proportional hazard model was used to estimate the effect of walking pace on incident VTE. We conducted a bidirectional Mendelian randomization (MR) analysis, by using 70 single-nucleotide polymorphisms (SNPs) from a walking pace genome-wide association studies (GWAS) and 93 SNPs from a VTE GWAS as instrumental variables. We used both individual-level data and GWAS summary statistics for mediation analysis.
Results
Over a median follow-up period of 12.8 years, 11,155 incident VTE cases were identified. The 10-year incidence rates for brisk and slow walking pace were 1.32% (confidence interval [CI]: 1.27–1.37%) and 3.90% (CI: 3.71–4.09%), respectively. For noncarriers, F2 and F5 carriers, the 10-year incidence rates were 1.70% (CI: 1.66–1.73%), 2.94% (CI: 2.66–3.22%), and 3.62% (CI: 3.39–3.84%), respectively. The overall risk of VTE for F5 mutation carriers with a brisk walking pace (2.65%) was smaller than that for noncarriers with a slow walking pace (3.66%). For F5 mutation carriers, brisk pace (but not steady pace) reduces the risk of VTE (p interaction < 0.05). MR analyses displayed a causal relationship (inverse variance weighted: p = 3.21 × 10⁻⁵) from walking pace to VTE incidence. Mediation analysis showed that serum albumin (ALB) and cystatin C (CYS) levels partially mediated the effect of brisk walking pace on the risk of VTE incidence, with mediation proportions of 8.7 to 11.7%, respectively.
Conclusion
On the population scale, the protective effect of brisk walking pace offsets the risk of VTE caused by Mendelian mutations. We provided preliminary evidence that a brisk walking pace causally reduces the risk of VTE. Serum ALB and CYS partially mediate this effect.
Keywords
walking pace - venous thromboembolism - prospective cohort - Mendelian randomization - mediationIntroduction
Walking pace has been reported to be associated with overall cardiovascular health frailty.[1] Venous thromboembolism (VTE) is a condition encompassing deep vein thrombosis and pulmonary embolism. It poses a significant health concern and is the third most common cardiovascular ailment in Western nations.[2] Twin research has suggested a heritability around 50%.[3] [4] It has been long recognized that rare Mendelian mutations in Prothrombin gene (F2) and the factor V Leiden gene (F5) genes contribute to inherited thrombophilia,[5] [6] whereas recent genome-wide association studies (GWAS) and subsequent polygenic risk scores approaches showed that common genetic variants could also be used to identify individuals at increased risk of VTE.[6]
Risk factors for VTE include a combination of genetics and lifestyle factors such as smoking and physical inactivity.[7] Strategies for VTE prevention have shifted from primarily targeting hospital-related risk factors to promoting heart-healthy lifestyles.[6] Regular exercise is associated with a lower risk of VTE compared with no exercise.[6] However, studies reporting on the association between physical activity and VTE risk show inconsistent results.[8] [9] [10] [11] [12] Walking is an accessible and cost-effective form of physical activity that is widely advocated for its numerous benefits to physical, mental, and social well-being.[13] [14]
Walking pace is linked with all-cause mortality,[15] cardiovascular disease (CVD),[16] type 2 diabetes mellitus (T2DM),[17] and chronic kidney disease.[18] However, research is lacking to study how self-reported walking pace affects the incidence of VTE. Walking pace also has a genetic cause. A GWAS on self-reported walking pace identified 70 independent associated loci.[19] These discovered genetic loci enable the Mendelian randomization (MR) study to explore the causal role of walking pace.
Furthermore, blood metabolites serve as crucial biomarkers, offering insights into the metabolic processes underlying VTE. Recent studies have suggested that certain blood metabolites are associated with VTE risk, highlighting the potential role of metabolic health in VTE prevention. For instance, elevated levels of certain lipid metabolites, such as glucose, creatinine, and C-reactive protein, have been linked to a higher incidence of VTE.[6]
Based on a large prospective cohort, our study aimed to first investigate whether walking pace is associated with the risk of VTE. We also examined the interaction between walking pace and genetic risk of VTE and assessed causality through an MR study. Finally, we evaluated the role of blood biomarkers in the relationship between walking pace and VTE.
Methods
Study Cohort and Design
For this study, we included 469,767 participants who were self-reported of White European ancestry and had data on walking pace at baseline. The follow-up end date for this study is December 2021. After excluding 11,145 participants with baseline VTE and 13,361 without genetic data, 445,261 remained for final analysis. The overall study design is shown in Visual Summary.
Assessment of Exposure
The information on self-reported walking pace was collected from the baseline touchscreen questionnaire. All participants were asked the question, “How would you describe your usual walking pace?” Options included “slow,” “steady,” and “brisk,” defined as <3, 3–4, and >4 miles per hour, respectively.
Case Definition
Incident VTE cases were identified from hospital admission records linked to Health Episode Statistics in England and Wales and the Scottish Morbidity Records in Scotland. Incident VTE was defined as a hospital admission with an International Classification of Diseases, Tenth Revision (ICD-10) code of I80, I82, I26, and O88.2 and self-reported VTE extracted from field code 20002 (1093, 1094, 1068).[6] To further reduce the effect of comorbidities on walking pace, we sequentially excluded participants who developed VTE within the first 2 years of follow-up, participants with CVD or diabetes at baseline, and those with leg and chest pain, and surgery of the toe or leg. The detailed study design and procedures have been described in a previous study.[20]
Ascertainment of Covariates
Covariates, including age, sex, assessment center, Townsend Deprivation Index,[21] smoking status, alcohol consumption, diet, sedentary behavior, and physical activity, were collected through touchscreen questionnaires at the baseline visit. Smoking and alcohol consumption status was self-reported as never, former, or current. Dietary factors were assessed using a previously published healthy diet score adapted according to American Heart Association guidelines.[22] [23] Physical activity was measured by the International Physical Activity Questionnaires group (Data-field 22032) and classified as low, moderate, or high, depending on the frequency and intensity of walking, moderate activity, vigorous activity, and Metabolic Equivalent Task, minutes/week. Sedentary behavior time was quantified at baseline by summing up the hours spent on TV watching, computer use (not at work), and driving. If the sum exceeded 24 hours per day, total sedentary behavior was recorded to 24 hours per day.[24] Self-reported frequency (frequency of walking for pleasure in last 4 weeks, data-Field 971) and duration (duration walking for pleasure, data-Field 981) of walking for pleasure were collected using the baseline touchscreen questionnaire. For walking frequency, UK Biobank provided six incremental categories, along with options for “Do not know” and “Prefer not to answer.” Participants were assigned to three groups: “slow,” “average,” and “high.” “Slow” was defined as walking 1 to 3 times in the last 4 weeks, “average” as walking 1 to 3 times per week, and “high” as walking more than 3 times per week. For walking duration, UK Biobank provided seven incremental categories, along with options for “Do not know” and “Prefer not to answer.” We categorized walking duration into three groups: “short,” “average,” and “long.” Short duration was defined as less than 30 minutes, average duration as 30 minutes to 1.5 hours and long duration as more than 1.5 hours.
Ascertainment of Mendelian Mutations
The genotyping process of the UK Biobank study was documented elsewhere.[25] We assigned each participant into three groups: (1) noncarriers; (2) F2 mutation carriers (G20210A mutation [rs1799963] heterozygous or homozygous); (3) F5 mutation carriers (G1691A mutation [rs6025] heterozygous or homozygous).
Association Analyses
The survival time for each participant was calculated as the duration from the time of the baseline visit to the date of diagnosis of VTE, death, loss to follow-up, or December 31, 2021, whichever occurred first. Cox proportional risk model was used to estimate the effect of walking pace on incident VTE. Hazard ratios (HRs) and 95% confidence intervals (CIs) were presented as the main metrics for association. We divided participants into three categories based on their self-reported walking pace: slow, steady, and brisk, with brisk pace as the reference group. We included up to 70 covariates in an incremental manner. That is, model 1 included five covariates, model 2 included seven more covariates, model 3 further included five more covariates. We used model 3 as the default model, unless otherwise stated. We added a model 4 to take into account the impact of missing covariates. To handle missing covariates, we employed a missing indicator for categorical variables and imputed the mean values for continuous variables.
Mendelian Randomization Analyses
To run MR between walking pace and VTE without overlapping samples, we generated a UKB-only VTE GWAS and subtracted it from the published VTE GWAS[6] meta-analysis summary statistics by using Metasubtract.[26] We conducted a bidirectional MR analysis, with 70 single-nucleotide polymorphisms (SNPs) from a recently published walking pace GWAS,[19] and 93 SNPs from another recently published VTE GWAS.[6] The TwoSampleMR R package[27] was utilized to conduct MR in this study, and the inverse variance weighted (IVW) method was used for the main analysis result.
Mediation Analyses
We first performed mediation analyses based on individual data using the R package “mediation.” We then used IVW product method for summary databased mediation analysis, where a total of 27 serum biomarkers from a recent GWAS study were evaluated for potential mediation roles (N = 363,228 individuals).[28]
All statistical analyses were performed using R software, version 4.3 (R Project for Statistical Computing). All tests were two-sided, and p < 0.05 was considered statistically significant.
Results
Baseline Characteristics
A total of 445,261 participants were included, with 7.4, 52.4, and 40.2% reporting slow, steady, and brisk walking paces, respectively ([Table 1]). The mean age was 56.7 years (standard deviation = 8.0), and 241,282 (54.2%) were female. Participants with a slow walking pace tended to be older, reside in areas with higher Townsend Deprivation Index scores, and exhibited higher prevalence rates of hypertension, CVD, and diabetes. Additionally, slow walkers were more likely to engage in low physical activity levels, spend more time sedentary, and have higher body mass index values.
Abbreviation: CVD, cardiovascular disease; .
Note: Continuous and categorical variables are presented as means (standard deviations) and percentages (%), respectively.
Association of Walking Pace with Venous Thromboembolism
During a median follow-up period of 12.8 years (5,544,739 person-years), we identified a total of 11,155 (2.50%) incident cases of VTE among a total of 445,261 participants, with 3,321 (1.85%), 6,164 (2.64%), and 1,670 (5.08%) for brisk (N = 179,137), steady (N = 233,223), and slow (N = 32,901) walking paces, respectively. Participants with slow walking paces exhibited notably higher cumulative incidences of VTE compared with those with brisk walking pace. The association between walking pace and incident VTE is statistically significant among all four statistical models and remains significant after we excluded further samples from cases based on four exclusion criteria (log-rank p < 0.0001; [Table 2]).
|
N |
Brisk |
Steady |
Slow |
p Trend |
|
|---|---|---|---|---|---|
|
Model (incrementally adjusting for more covariates) |
|||||
|
Model 1 |
445,261 |
1.00 |
1.28 (1.22–1.34) |
2.30 (2.15–2.46) |
<0.0001 |
|
Model 2 |
445,261 |
1.00 |
1.25 (1.19–1.32) |
2.11 (1.94–2.31) |
<0.0001 |
|
Model 3 |
445,261 |
1.00 |
1.13 (1.06–1.19) |
1.52 (1.38–1.66) |
<0.0001 |
|
Model 4 |
445,261 |
1.00 |
1.10 (1.05–1.15) |
1.43 (1.34–1.54) |
<0.0001 |
|
Exclusion of subjects with baseline condition |
|||||
|
VTE[a] |
441,643 |
1.00 |
1.12 (1.05–1.19) |
1.45 (1.31–1.60) |
<0.0001 |
|
CVD |
422,184 |
1.00 |
1.11 (1.05–1.18) |
1.55 (1.40–1.71) |
<0.0001 |
|
T2DM |
416,458 |
1.00 |
1.11 (1.04–1.17) |
1.62 (1.47–1.80) |
<0.0001 |
|
Leg/toe Dx[b] |
378,589 |
1.00 |
1.07 (1.01–1.14) |
1.61 (1.43–1.81) |
<0.0001 |
Abbreviations: CVD, cardiovascular disease; T2DM, Type 2 diabetes mellitus; VTE, venous thromboembolism.
Notes: Model 1 adjusted for age (continuous, years), sex (male, female), UK Biobank assessment center, Townsend Deprivation Index (continuous), and household income (less than £18,000, £18,000 to £29,999, £30,000 to £51,999, £52,000 to £100,000, and greater than £100,000). Model 2 adjusted for all covariates used in Model 1, plus smoking status (current, previous, never), alcohol consumption (current, previous, never), healthy diet score (0, 1, 2, 3, 4, 5), physical activity (low, moderate, high), sedentary (continuous, hour/day), duration of walking for pleasure (short, average, long), and frequency of walking for pleasure (slow, average, high). Model 3 adjusted for all covariates used in Model 2, plus body mass index (continuous, kg/m2), waist-to-hip ratio (continuous), hypertension history (yes/no), diabetes history (yes/no), and CVD history (yes/no). Model 4 adjusted for Model 3 and imputed variables.
a Removed subjects with VTE diagnosed within 2 years from baseline.
b Removed subjects with T2DM; removed subjects with chest pain, surgery of toe or leg.
Association of Mendelian Mutations with Venous Thromboembolism
Similarly, using noncarriers as a reference, the HRs for F2 and F5 mutation carriers were significantly higher ([Table 3]). The associations remain significant when the number of adjusted covariates increased from 5 (model 1) to 12 (model 2) and further to 17 (model 3). In general, the HRs for F2 and F5 mutation carriers increased slightly as more covariates are adjusted for. This indicates that model 3 with 17 covariates had a better power to detect true association signals. Based on model 3, the HR for F2 and F5 mutation carriers are 1.76 and 2.30, respectively.
a The number of covariates adjusted are the same as that for Table 2.
Ten-Year Risk of Venous Thromboembolism
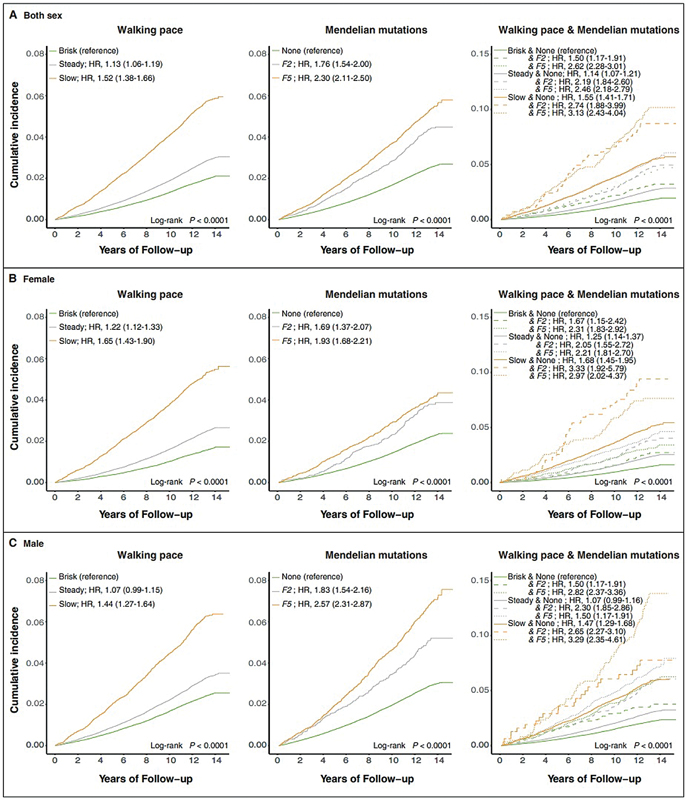
The 10-year incidence rate for brisk, steady, and slow walking paces is 1.32, 1.90, and 3.90%, respectively. Similarly, the 10-year incidence rate for noncarriers, F2, and F5 mutation carriers are 1.70, 2.94, and 3.62%, respectively. Therefore, the effect of walking pace is stronger than that of the established Mendelian mutation F5 (a 10-year incidence rate difference of 2.58 vs. 1.92%; [Fig. 1]). There was a significant risk reduction in individuals who were noncarriers with brisk walking pace (risk = 1.24%, reduction = 2.43%) compared with those who were noncarriers but had a slow walking pace (risk = 3.66%) ([Fig. 1]). Similarly, among individuals with F5 mutation carriers, the risk for those with a slow walking pace increased to 7.75%, which could be reduced to 2.65% among those with a brisk walking pace (reduction = 5.10%). Of note, the 10-year risk of VTE for both F2 and F5 mutation carriers with a brisk walking pace (risk: 2.16% for F2, 2.65% for F5) was smaller than that for noncarriers with a slow walking pace (risk: 3.66%). The 10-year risk of VTE was significantly higher in males than in females. Males with F5 mutation carriers and a slow walking pace had the highest 10-year risk of VTE (risk = 9.52%; [Fig. 1]).

Combined Effect of Walking Pace and Mendelian Mutations
A slow walking pace is associated with an increased cumulative incidence of VTE, even higher than the F5 mutation carrier in all participants, with an even greater difference in females, whereas the opposite is true for males ([Fig. 2A–C]). We found slight interaction between walking pace and genetic mutation status on VTE risk (p interaction < 0.05). We further evaluated the joint effect of walking pace and Mendelian Mutations on the risk of incident VTE. As expected, participants with slow walking paces and F5 mutation carriers exhibited notably higher cumulative incidences of VTE and the highest risk of VTE (HR: 3.13 [2.43–4.04]), followed by those with slow walking pace and F2 mutation carriers (HR: 2.74 [1.88–3.99]; [Fig. 2A]). Females with slow walking pace and F2 mutation carriers had higher cumulative incidences of VTE and the highest risk of VTE (HR: 3.33 [1.92–5.79]), whereas males with slow walking pace and F5 mutation carriers had higher cumulative incidence rates and risk of VTE (HR: 3.29 [2.35–4.61]).
Mediators for Associations between Walking Pace and Risk of Venous Thromboembolism
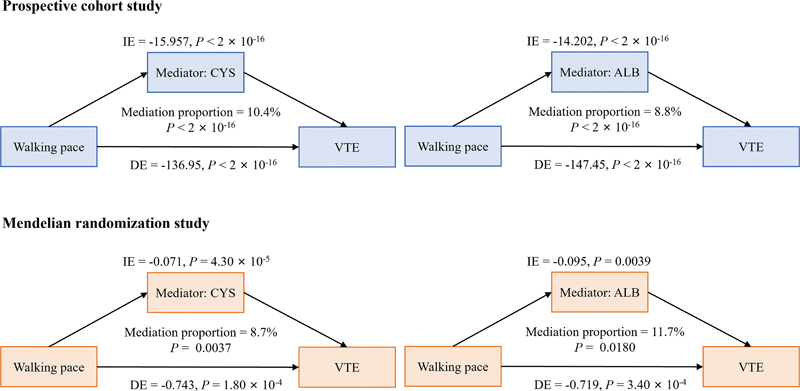
Given the association between walking pace and height and also between height and VTE, we first conducted a mediation analysis to assess whether slow pace is a mediator for the effect of height on VTE risk, but we found no significant causal mediation effect (p = 0.8). Height is not a mediator either for the effect of slow pace on VTE risk. We next explored the mediating effect of blood biomarkers in the relationship between walking pace and risks of VTE based on indirect effect, direct effect, and the proportion of mediation. As shown in [Fig. 3], after adjusting for age and sex, 15 blood biomarkers partially mediated the association between walking pace and risks of VTE. Cystatin C (CYS) had the highest proportion of significant mediating effects at 10.4%, followed by albumin (ALB) at 8.8%.
Mendelian Randomization Analysis
A total of 63 overlapping SNPs were included as instrumental variables for the MR analysis. The IVW method p-value was 3.21 × 10⁻⁵. This significance is supported by four other commonly used testing methods: simple median, weighted median, maximum likelihood, and contamination mixture ([Fig. 4]). Consistent with our core MR methods, the IVW radial MR causal estimates suggested a significant causal association between brisk walking pace and reduced risk of VTE (p = 3.14 × 10⁻⁵). The plot indicates several outliers that deviate from the overall causal relationship between walking pace and VTE ([Fig. 4]). Further analysis using MR-PRESSO identified several SNPs as outliers, which were subsequently corrected. After adjusting for these outliers, the causal estimate between walking pace and VTE became even stronger, with an outlier-corrected p-value of 6.210−10. Additionally, the MR-Egger intercept test yielded p-values exceeding 0.05 (p = 0.787), indicating the absence of horizontal pleiotropy-induced effects on the MR results. In reverse MR analysis, no causal effect of VTE on walking pace was observed (IVW method p = 0.05619). After a series of processes for exploring exposure–blood biomarkers–outcome causal pathways. There are mediating effects of ALB (mediation proportion of 11.7%, p = 0.0180) and CYS (mediation proportion of 8.7%, p = 0.0037) in the causal relationship between walking pace and VTE ([Fig. 3]).

Discussion
We examined the association between walking pace, genetic predisposition, and the risk of incident VTE in a large prospective cohort. Our study demonstrates a significant relationship between walking pace and the risk of VTE, with slow walking pace associated with a markedly increased risk. Through MR, we offered preliminary evidence on the causality of brisk walking pace on reduced risk of VTE. Both CYS and ALB are significant mediators in the relationship between walking pace and VTE risk. These findings have substantial implications for public health and clinical practice, as they highlight the potential of walking pace as a modifiable risk factor in the prevention of VTE. To the best of our knowledge, this is the first large-scale study examining the association between walking pace and VTE risk. Our observations were consistent with existing evidence supporting the positive effects of brisk walking pace on coronary artery disease,[29] stroke,[30] T2DM,[17] and all-cause mortality.[31]
The prospective design, large sample size, long-term follow-up (mean 12.8 years), and high-quality data from the UK Biobank allowed us to consider the abundance of information on sociodemographic factors, lifestyles, and other covariates, providing sufficient statistical power. Our study extends the current understanding of VTE risk factors by incorporating physical capability, specifically walking pace, into the risk assessment framework. Previous studies have primarily focused on genetic predispositions and traditional lifestyle factors such as diet, smoking, and overall physical activity levels. The novel finding that walking pace itself can influence VTE risk underscores the importance of considering specific physical behaviors in VTE prevention strategies.
The findings of this study have direct clinical implications. Health care providers should consider incorporating assessments of walking pace into routine evaluations of patients, particularly those with known risk factors for VTE. Interventions aimed at promoting brisk walking could be a simple yet effective strategy to reduce VTE risk. Such interventions could be particularly beneficial for individuals with genetic predispositions to VTE, as our study suggests that brisk walking can mitigate the elevated risk associated with F2 and F5 mutations. From a public health perspective, promoting walking at a brisk pace could serve as a cost-effective and widely accessible intervention to reduce VTE incidence at the population level. Public health campaigns and community programs designed to encourage brisk walking could have a significant impact on reducing the overall burden of VTE. Additionally, urban planning that promotes walkable environments and provides safe, accessible spaces for walking could further support these efforts.
Brisk walking pace enhances aerobic fitness[32] and is strongly correlated with maximal oxygen uptake.[33] Recently, studies have shown that blood metabolites are key indicators of the metabolic processes related to VTE. Therefore, we further investigated the mediating role of blood biomarkers in the influence of walking pace on VTE. The results show that CYS and ALB play a partially mediating role in VTE induced by walking pace. CYS plays a crucial role in the antioxidative processes.[34] [35] An imbalance in CYS level is associated with cardiovascular disorders.[36] ALB is the most abundant plasma protein and plays a crucial role in maintaining redox homeostasis. It contains multiple thiol groups, primarily in the form of cysteine residues, which can undergo reversible oxidation and reduction.[35] ALB exhibits antioxidant, antiplatelet, and antithrombotic activities.[37] It also binds antithrombin, inhibits liver synthesis, and enhances the neutralization of some coagulation factors.[38] [39] Oxidative stress has been linked to VTE through the oxidation of fibrinogen.[40] This insight into the role of blood biomarkers enhances our understanding of the biological mechanisms linking physical activity and VTE and underscores the importance of metabolic health in VTE prevention.
Despite the robust findings, our study has several limitations. The self-reported nature of walking pace introduces the possibility of reporting bias. Although we carefully considered adjustments for potential confounding factors, the effects of residual confounding or unmeasured factors may still exist. In the current direct oral anticoagulant era, only the sickest patients are hospitalized. Therefore, the control group in our study might still contain individuals who could be diagnosed as cases. Future studies that utilize more sensitive approaches to identify cases might increase statistical power.
The biological mechanisms underlying the relationship between slow walking pace and increased VTE risk are multifaceted. Slow walking pace may reflect underlying frailty, reduced muscle strength, and poorer cardiovascular and metabolic health, all of which are known risk factors for VTE. Additionally, slow walkers may engage in less overall physical activity, leading to prolonged periods of immobility, which is a well-established risk factor for VTE due to venous stasis. Furthermore, the inflammatory and coagulation pathways could be influenced by physical activity levels. Regular brisk walking has been shown to improve endothelial function, reduce inflammation, and enhance fibrinolytic activity, all of which contribute to a reduced risk of thrombus formation. In contrast, slow walking pace may be indicative of reduced engagement in these beneficial activities, thereby increasing VTE risk. Finally, the study population, primarily of European descent, may limit the generalizability of the findings to other ethnic groups.
Conclusion
In this population-based study of adults in the United Kingdom, a slow walking pace is associated with higher risks of VTE, especially among participants with slow walking paces and carriers with Mendelian mutation in the Prothrombin gene (F2) and the factor V Leiden gene (F5). We provided preliminary evidence that a brisk walking pace causally reduces the risk of VTE. Both CYS and ALB are significant mediators in the relationship between walking pace and VTE risk. Slow walking pace is a promising modifiable risk factor to consider for lifestyle interventions and may be a potential target for the treatment or prevention of VTE. Future research should aim to replicate these findings in diverse populations and explore the mechanisms through which walking pace influences VTE risk in greater detail.
What is known about this topic?
-
Walking pace is associated with the risk of coronary artery diseases, but no study has investigated its association with VTE.
-
The extent and causality of the association between walking pace and VTE have not yet been investigated.
What does this paper add?
-
A slow walking pace is associated with higher risks of VTE.
-
The 10-year risk difference between brisk and slow walking pace is equivalent to that between noncarriers and carriers of the two established Mendelian mutations: G20210A (c.*97 G > A) in the Prothrombin gene (F2) gene, p.R534Q in the factor V Leiden gene (F5) gene.
-
Through MR, we provided preliminary evidence that a brisk walking pace causally reduces the risk of VTE.
-
Through mediation analyses, we showed that serum ALB and CYS levels partially mediated the effect of brisk walking pace on the risk of VTE incidence.
Conflict of Interest
None declared.
Acknowledgment
We thank the participants of the UK Biobank cohort for sharing their health-related information. The analysis of this study was supported by the Center for Computational Science and Engineering at the Southern University of Science and Technology.
Ethical Approval Statement
All participants provided written informed consent at their baseline visit. Ethical approval of the UK Biobank study was obtained from the National Information Governance Board for Health and Social Care and the National Health Service North West Multi-Centre Research Ethics Committee (Ref. 11/NW/0382). This research was conducted using the UK Biobank resources under application 66137.
Authors' Contribution
All authors meet authorship criteria by contributing to components of research conception, design, interpretation of results, and manuscript revisions. J.H. and W.X. conceptualized and designed the study, conducted formal data analyses, and drafted the initial manuscript. C.Y. and A.S.P. contributed to data analysis and manuscript writing. Y.Q., R.S., J.M.R., and V.N. provided input into the study design and revised the manuscript. T.W. and P.W.C.L. interpreted the results and revised the manuscript. All authors reviewed the final manuscript as submitted.
-
References
- 1 Goldney J, Dempsey PC, Henson J. et al. Self-reported walking pace and 10-year cause-specific mortality: a UK biobank investigation. Prog Cardiovasc Dis 2023; 81: 17-23
- 2 Cohen AT, Agnelli G, Anderson FA. et al; VTE Impact Assessment Group in Europe (VITAE). Venous thromboembolism (VTE) in Europe. The number of VTE events and associated morbidity and mortality. Thromb Haemost 2007; 98 (04) 756-764
- 3 Larsen TB, Sørensen HT, Skytthe A, Johnsen SP, Vaupel JW, Christensen K. Major genetic susceptibility for venous thromboembolism in men: a study of Danish twins. Epidemiology 2003; 14 (03) 328-332
- 4 Heit JA, Phelps MA, Ward SA, Slusser JP, Petterson TM, De Andrade M. Familial segregation of venous thromboembolism. J Thromb Haemost 2004; 2 (05) 731-736
- 5 Connors JM. Thrombophilia testing and venous thrombosis. N Engl J Med 2017; 377 (12) 1177-1187
- 6 Ghouse J, Tragante V, Ahlberg G. et al. Genome-wide meta-analysis identifies 93 risk loci and enables risk prediction equivalent to monogenic forms of venous thromboembolism. Nat Genet 2023; 55 (03) 399-409
- 7 Khan F, Tritschler T, Kahn SR, Rodger MA. Venous thromboembolism. Lancet 2021; 398 (10294): 64-77
- 8 Wattanakit K, Lutsey PL, Bell EJ. et al. Association between cardiovascular disease risk factors and occurrence of venous thromboembolism. A time-dependent analysis. Thromb Haemost 2012; 108 (03) 508-515
- 9 Olson NC, Cushman M, Judd SE. et al. American Heart Association's Life's Simple 7 and risk of venous thromboembolism: the Reasons for Geographic and Racial Differences in Stroke (REGARDS) study. J Am Heart Assoc 2015; 4 (03) e001494
- 10 Armstrong ME, Green J, Reeves GK, Beral V, Cairns BJ. Million Women Study Collaborators. Frequent physical activity may not reduce vascular disease risk as much as moderate activity: large prospective study of women in the United Kingdom. Circulation 2015; 131 (08) 721-729
- 11 Borch KH, Hansen-Krone I, Braekkan SK. et al. Physical activity and risk of venous thromboembolism. The Tromso study. Haematologica 2010; 95 (12) 2088-2094
- 12 Evensen LH, Brækkan SK, Hansen JB. Regular physical activity and risk of venous thromboembolism. Semin Thromb Hemost 2018; 44 (08) 765-779
- 13 Murtagh EM, Nichols L, Mohammed MA, Holder R, Nevill AM, Murphy MH. The effect of walking on risk factors for cardiovascular disease: an updated systematic review and meta-analysis of randomised control trials. Prev Med 2015; 72: 34-43
- 14 Stamatakis E, Williamson C, Kelly P. et al. Infographic. Self-rated walking pace and all-cause, cardiovascular disease and cancer mortality: individual participant pooled analysis of 50 225 walkers from 11 population British cohorts. Br J Sports Med 2019; 53 (21) 1381-1382
- 15 Ganna A, Ingelsson E. 5 year mortality predictors in 498,103 UK Biobank participants: a prospective population-based study. Lancet 2015; 386 (9993): 533-540
- 16 Imran TF, Orkaby A, Chen J. et al. Walking pace is inversely associated with risk of death and cardiovascular disease: the Physicians' Health Study. Atherosclerosis 2019; 289: 51-56
- 17 Boonpor J, Ho FK, Gray SR, Celis-Morales CA. Association of self-reported walking pace with type 2 diabetes incidence in the UK biobank prospective cohort study. Mayo Clin Proc 2022; 97 (09) 1631-1640
- 18 He P, Ye Z, Liu M. et al. Association of handgrip strength and/or walking pace with incident chronic kidney disease: a UK biobank observational study. J Cachexia Sarcopenia Muscle 2023; 14 (02) 805-814
- 19 Timmins IR, Zaccardi F, Nelson CP, Franks PW, Yates T, Dudbridge F. Genome-wide association study of self-reported walking pace suggests beneficial effects of brisk walking on health and survival. Commun Biol 2020; 3 (01) 634
- 20 Sudlow C, Gallacher J, Allen N. et al. UK biobank: an open access resource for identifying the causes of a wide range of complex diseases of middle and old age. PLoS Med 2015; 12 (03) e1001779
- 21 Adams J, Ryan V, White M. How accurate are Townsend Deprivation Scores as predictors of self-reported health? A comparison with individual level data. J Public Health (Oxf) 2005; 27 (01) 101-106
- 22 Lloyd-Jones DM, Hong Y, Labarthe D. et al; American Heart Association Strategic Planning Task Force and Statistics Committee. Defining and setting national goals for cardiovascular health promotion and disease reduction: the American Heart Association's strategic impact goal through 2020 and beyond. Circulation 2010; 121 (04) 586-613
- 23 Pazoki R, Dehghan A, Evangelou E. et al. Genetic predisposition to high blood pressure and lifestyle factors: associations with midlife blood pressure levels and cardiovascular events. Circulation 2018; 137 (07) 653-661
- 24 Weber A, Leitzmann MF, Sedlmeier AM. et al. Association between physical activity, grip strength and sedentary behaviour with incidence of malignant melanoma: results from the UK Biobank. Br J Cancer 2021; 125 (04) 593-600
- 25 Bycroft C, Freeman C, Petkova D. et al. The UK biobank resource with deep phenotyping and genomic data. Nature 2018; 562 (7726): 203-209
- 26 Nolte IM. Metasubtract: an R-package to analytically produce leave-one-out meta-analysis GWAS summary statistics. Bioinformatics 2020; 36 (16) 4521-4522
- 27 Hemani G, Zheng J, Elsworth B. et al. The MR-base platform supports systematic causal inference across the human phenome. eLife 2018; 7: 7
- 28 Sinnott-Armstrong N, Tanigawa Y, Amar D. et al; FinnGen. Author correction: genetics of 35 blood and urine biomarkers in the UK biobank. Nat Genet 2021; 53 (11) 1622-1622
- 29 Zaccardi F, Timmins IR, Goldney J. et al. Self-reported walking pace, polygenic risk scores and risk of coronary artery disease in UK biobank. Nutr Metab Cardiovasc Dis 2022; 32 (11) 2630-2637
- 30 Hayes S, Forbes JF, Celis-Morales C. et al. Association between walking pace and stroke incidence: findings from the UK biobank prospective cohort study. Stroke 2020; 51 (05) 1388-1395
- 31 Celis-Morales CA, Gray S, Petermann F. et al. Walking pace is associated with lower risk of all-cause and cause-specific mortality. Med Sci Sports Exerc 2019; 51 (03) 472-480
- 32 Murphy MH, Nevill AM, Murtagh EM, Holder RL. The effect of walking on fitness, fatness and resting blood pressure: a meta-analysis of randomised, controlled trials. Prev Med 2007; 44 (05) 377-385
- 33 Yates T, Zaccardi F, Dhalwani NN. et al. Association of walking pace and handgrip strength with all-cause, cardiovascular, and cancer mortality: a UK biobank observational study. Eur Heart J 2017; 38 (43) 3232-3240
- 34 Kleinman WA, Richie Jr JP. Status of glutathione and other thiols and disulfides in human plasma. Biochem Pharmacol 2000; 60 (01) 19-29
- 35 Turell L, Radi R, Alvarez B. The thiol pool in human plasma: the central contribution of albumin to redox processes. Free Radic Biol Med 2013; 65: 244-253
- 36 Stachniuk J, Kubalczyk P, Furmaniak P, Głowacki R. A versatile method for analysis of saliva, plasma and urine for total thiols using HPLC with UV detection. Talanta 2016; 155: 70-77
- 37 Belinskaia DA, Voronina PA, Goncharov NV. Integrative role of albumin: evolutionary, biochemical and pathophysiological aspects. J Evol Biochem Physiol 2021; 57 (06) 1419-1448
- 38 Basili S, Carnevale R, Nocella C. et al; PRO-LIVER Collaborators. Serum albumin is inversely associated with portal vein thrombosis in cirrhosis. Hepatol Commun 2019; 3 (04) 504-512
- 39 Violi F, Novella A, Pignatelli P. et al; REPOSI (REgistro POliterapie SIMI, Società Italiana di Medicina Interna) Study Group. Low serum albumin is associated with mortality and arterial and venous ischemic events in acutely ill medical patients. Results of a retrospective observational study. Thromb Res 2023; 225: 1-10
- 40 Martinez M, Cuker A, Mills A. et al. Nitrated fibrinogen is a biomarker of oxidative stress in venous thromboembolism. Free Radic Biol Med 2012; 53 (02) 230-236
Address for correspondence
Publication History
Received: 09 August 2024
Accepted: 23 October 2024
Accepted Manuscript online:
05 November 2024
Article published online:
16 January 2025
© 2025. The Author(s). This is an open access article published by Thieme under the terms of the Creative Commons Attribution-NonDerivative-NonCommercial License, permitting copying and reproduction so long as the original work is given appropriate credit. Contents may not be used for commercial purposes, or adapted, remixed, transformed or built upon. (https://creativecommons.org/licenses/by-nc-nd/4.0/)
Georg Thieme Verlag KG
Oswald-Hesse-Straße 50, 70469 Stuttgart, Germany
-
References
- 1 Goldney J, Dempsey PC, Henson J. et al. Self-reported walking pace and 10-year cause-specific mortality: a UK biobank investigation. Prog Cardiovasc Dis 2023; 81: 17-23
- 2 Cohen AT, Agnelli G, Anderson FA. et al; VTE Impact Assessment Group in Europe (VITAE). Venous thromboembolism (VTE) in Europe. The number of VTE events and associated morbidity and mortality. Thromb Haemost 2007; 98 (04) 756-764
- 3 Larsen TB, Sørensen HT, Skytthe A, Johnsen SP, Vaupel JW, Christensen K. Major genetic susceptibility for venous thromboembolism in men: a study of Danish twins. Epidemiology 2003; 14 (03) 328-332
- 4 Heit JA, Phelps MA, Ward SA, Slusser JP, Petterson TM, De Andrade M. Familial segregation of venous thromboembolism. J Thromb Haemost 2004; 2 (05) 731-736
- 5 Connors JM. Thrombophilia testing and venous thrombosis. N Engl J Med 2017; 377 (12) 1177-1187
- 6 Ghouse J, Tragante V, Ahlberg G. et al. Genome-wide meta-analysis identifies 93 risk loci and enables risk prediction equivalent to monogenic forms of venous thromboembolism. Nat Genet 2023; 55 (03) 399-409
- 7 Khan F, Tritschler T, Kahn SR, Rodger MA. Venous thromboembolism. Lancet 2021; 398 (10294): 64-77
- 8 Wattanakit K, Lutsey PL, Bell EJ. et al. Association between cardiovascular disease risk factors and occurrence of venous thromboembolism. A time-dependent analysis. Thromb Haemost 2012; 108 (03) 508-515
- 9 Olson NC, Cushman M, Judd SE. et al. American Heart Association's Life's Simple 7 and risk of venous thromboembolism: the Reasons for Geographic and Racial Differences in Stroke (REGARDS) study. J Am Heart Assoc 2015; 4 (03) e001494
- 10 Armstrong ME, Green J, Reeves GK, Beral V, Cairns BJ. Million Women Study Collaborators. Frequent physical activity may not reduce vascular disease risk as much as moderate activity: large prospective study of women in the United Kingdom. Circulation 2015; 131 (08) 721-729
- 11 Borch KH, Hansen-Krone I, Braekkan SK. et al. Physical activity and risk of venous thromboembolism. The Tromso study. Haematologica 2010; 95 (12) 2088-2094
- 12 Evensen LH, Brækkan SK, Hansen JB. Regular physical activity and risk of venous thromboembolism. Semin Thromb Hemost 2018; 44 (08) 765-779
- 13 Murtagh EM, Nichols L, Mohammed MA, Holder R, Nevill AM, Murphy MH. The effect of walking on risk factors for cardiovascular disease: an updated systematic review and meta-analysis of randomised control trials. Prev Med 2015; 72: 34-43
- 14 Stamatakis E, Williamson C, Kelly P. et al. Infographic. Self-rated walking pace and all-cause, cardiovascular disease and cancer mortality: individual participant pooled analysis of 50 225 walkers from 11 population British cohorts. Br J Sports Med 2019; 53 (21) 1381-1382
- 15 Ganna A, Ingelsson E. 5 year mortality predictors in 498,103 UK Biobank participants: a prospective population-based study. Lancet 2015; 386 (9993): 533-540
- 16 Imran TF, Orkaby A, Chen J. et al. Walking pace is inversely associated with risk of death and cardiovascular disease: the Physicians' Health Study. Atherosclerosis 2019; 289: 51-56
- 17 Boonpor J, Ho FK, Gray SR, Celis-Morales CA. Association of self-reported walking pace with type 2 diabetes incidence in the UK biobank prospective cohort study. Mayo Clin Proc 2022; 97 (09) 1631-1640
- 18 He P, Ye Z, Liu M. et al. Association of handgrip strength and/or walking pace with incident chronic kidney disease: a UK biobank observational study. J Cachexia Sarcopenia Muscle 2023; 14 (02) 805-814
- 19 Timmins IR, Zaccardi F, Nelson CP, Franks PW, Yates T, Dudbridge F. Genome-wide association study of self-reported walking pace suggests beneficial effects of brisk walking on health and survival. Commun Biol 2020; 3 (01) 634
- 20 Sudlow C, Gallacher J, Allen N. et al. UK biobank: an open access resource for identifying the causes of a wide range of complex diseases of middle and old age. PLoS Med 2015; 12 (03) e1001779
- 21 Adams J, Ryan V, White M. How accurate are Townsend Deprivation Scores as predictors of self-reported health? A comparison with individual level data. J Public Health (Oxf) 2005; 27 (01) 101-106
- 22 Lloyd-Jones DM, Hong Y, Labarthe D. et al; American Heart Association Strategic Planning Task Force and Statistics Committee. Defining and setting national goals for cardiovascular health promotion and disease reduction: the American Heart Association's strategic impact goal through 2020 and beyond. Circulation 2010; 121 (04) 586-613
- 23 Pazoki R, Dehghan A, Evangelou E. et al. Genetic predisposition to high blood pressure and lifestyle factors: associations with midlife blood pressure levels and cardiovascular events. Circulation 2018; 137 (07) 653-661
- 24 Weber A, Leitzmann MF, Sedlmeier AM. et al. Association between physical activity, grip strength and sedentary behaviour with incidence of malignant melanoma: results from the UK Biobank. Br J Cancer 2021; 125 (04) 593-600
- 25 Bycroft C, Freeman C, Petkova D. et al. The UK biobank resource with deep phenotyping and genomic data. Nature 2018; 562 (7726): 203-209
- 26 Nolte IM. Metasubtract: an R-package to analytically produce leave-one-out meta-analysis GWAS summary statistics. Bioinformatics 2020; 36 (16) 4521-4522
- 27 Hemani G, Zheng J, Elsworth B. et al. The MR-base platform supports systematic causal inference across the human phenome. eLife 2018; 7: 7
- 28 Sinnott-Armstrong N, Tanigawa Y, Amar D. et al; FinnGen. Author correction: genetics of 35 blood and urine biomarkers in the UK biobank. Nat Genet 2021; 53 (11) 1622-1622
- 29 Zaccardi F, Timmins IR, Goldney J. et al. Self-reported walking pace, polygenic risk scores and risk of coronary artery disease in UK biobank. Nutr Metab Cardiovasc Dis 2022; 32 (11) 2630-2637
- 30 Hayes S, Forbes JF, Celis-Morales C. et al. Association between walking pace and stroke incidence: findings from the UK biobank prospective cohort study. Stroke 2020; 51 (05) 1388-1395
- 31 Celis-Morales CA, Gray S, Petermann F. et al. Walking pace is associated with lower risk of all-cause and cause-specific mortality. Med Sci Sports Exerc 2019; 51 (03) 472-480
- 32 Murphy MH, Nevill AM, Murtagh EM, Holder RL. The effect of walking on fitness, fatness and resting blood pressure: a meta-analysis of randomised, controlled trials. Prev Med 2007; 44 (05) 377-385
- 33 Yates T, Zaccardi F, Dhalwani NN. et al. Association of walking pace and handgrip strength with all-cause, cardiovascular, and cancer mortality: a UK biobank observational study. Eur Heart J 2017; 38 (43) 3232-3240
- 34 Kleinman WA, Richie Jr JP. Status of glutathione and other thiols and disulfides in human plasma. Biochem Pharmacol 2000; 60 (01) 19-29
- 35 Turell L, Radi R, Alvarez B. The thiol pool in human plasma: the central contribution of albumin to redox processes. Free Radic Biol Med 2013; 65: 244-253
- 36 Stachniuk J, Kubalczyk P, Furmaniak P, Głowacki R. A versatile method for analysis of saliva, plasma and urine for total thiols using HPLC with UV detection. Talanta 2016; 155: 70-77
- 37 Belinskaia DA, Voronina PA, Goncharov NV. Integrative role of albumin: evolutionary, biochemical and pathophysiological aspects. J Evol Biochem Physiol 2021; 57 (06) 1419-1448
- 38 Basili S, Carnevale R, Nocella C. et al; PRO-LIVER Collaborators. Serum albumin is inversely associated with portal vein thrombosis in cirrhosis. Hepatol Commun 2019; 3 (04) 504-512
- 39 Violi F, Novella A, Pignatelli P. et al; REPOSI (REgistro POliterapie SIMI, Società Italiana di Medicina Interna) Study Group. Low serum albumin is associated with mortality and arterial and venous ischemic events in acutely ill medical patients. Results of a retrospective observational study. Thromb Res 2023; 225: 1-10
- 40 Martinez M, Cuker A, Mills A. et al. Nitrated fibrinogen is a biomarker of oxidative stress in venous thromboembolism. Free Radic Biol Med 2012; 53 (02) 230-236