

Subscribe to RSS
DOI: 10.1055/s-0043-108764
Reference Curve for the Mean Uterine Artery Pulsatility Index in Singleton Pregnancies
Article in several languages: English | deutschAuthors

Abstract
Introduction Doppler sonography of the uterine artery (UA) is done to monitor pregnancies, because the detected flow patterns are useful to draw inferences about possible disorders of trophoblast invasion. Increased resistance in the UA is associated with an increased risk of preeclampsia and/or intrauterine growth restriction (IUGR) and perinatal mortality. In the absence of standardized figures, the normal ranges of the various available reference curves sometimes differ quite substantially from one another. The causes for this are differences in the flow patterns of the UA depending on the position of the pulsed Doppler gates as well as branching of the UA. Because of the discrepancies between the different reference curves and the practical problems this poses for guideline recommendations, we thought it would be useful to create our own reference curves for Doppler measurements of the UA obtained from a singleton cohort under standardized conditions.
Material and Methods This retrospective cohort study was carried out in the Department of Obstetrics of the Charité – Universitätsmedizin Berlin, the Department for Obstetrics and Prenatal Medicine of the University Hospital Halle (Saale) and the Center for Prenatal Diagnostics and Human Genetics Kurfürstendamm 199. Available datasets from the three study locations were identified and reference curves were generated using the LMS method. Measured values were correlated with age of gestation, and a cubic model and Box-Cox power transformation (L), the median (M) and the coefficient of variation (S) were used to smooth the curves.
Results 103 720 Doppler examinations of the UA carried out in singleton pregnancies from the 11th week of gestation (10 + 1 GW) were analyzed. The mean pulsatility index (Mean PI) showed a continuous decline over the course of pregnancy, dropping to a plateau of around 0.84 between the 23rd and 27th GW, after which it decreased again.
Conclusion Age of gestation, placental position, position of pulsed Doppler gates and branching of the UA can all change the flow pattern. The mean pulsatility index (Mean PI) showed a continuous decrease over time. There were significant differences between our data and alternative reference curves. A system of classifying Doppler studies and a reference curve adapted to the current technology are urgently required to differentiate better between physiological and pathological findings.
Introduction
Doppler sonography of the uterine artery (UA) was already described in the 1980s and has been used extensively since the 1990s to monitor high-risk pregnancies.
Increased resistances in the UA is the sonographic correlate for disordered trophoblast invasion which leads to reduced development of the vascular bed and high resistance [1]. Doppler sonography of the UA can therefore be used for screening as increased resistance with or without notching is an indicator of reduced blood flow in the maternal compartment of the placenta [2], [3].
Several studies have shown that increased resistances in the UA are also associated with an increased risk of preeclampsia and/or intrauterine growth restriction (IUGR), premature placental abruption and perinatal death [4], [5], [6], [7].
However, use of the method is still not sufficiently standardized and the normal ranges of the different reference curves vary quite considerably. Possible explanations for this could be differences in data collection, differences in study populations or divergences in the definition of preeclampsia.
Standardizing Doppler measurement of the UA is important for two reasons:
-
Uterine vascular resistance decreases over the course of the UA from proximal (near the cervix) to distal (crossing the external iliac artery).
-
The flow profile changes depending on branching of the UA because the flow pattern and vascular resistance of the UA do not necessarily represent blood flow in the main branch of the UA.
It is known that the values for the pulsatility index (PI) in the immediate vicinity of the cervix are normally higher than the values measured more distally [8].
With certain limitations, the current guidelines of the International Society of Ultrasound in Obstetrics and Gynecology (ISUOG) only differentiate between findings obtained by transvaginal measurement and findings of transabdominal examinations [9]. The reference curves of Papageorghiou and colleagues should be used for transvaginal measurements [10] and the reference curves of Gomez et al. for abdominal measurements [11].
From a practical point of view, using two different reference curves to assess the same artery is problematic.
Our working groups carry out transabdominal measurements of uterine vascular resistance in the ascending branch of the UA in the section proximal to the external iliac artery crossing the UA. If the UA branches out prior to crossing the external iliac artery, the branch with the higher systolic blood flow velocity is assessed. In transvaginal measurements, resistance in the UA is measured in the paracervical area. Irrespective of whether the examiner chooses a transabdominal or a transvaginal approach, the incidence angle between the ultrasound probe and the artery should be less than 60° and the maximum systolic flow velocity should be at least 60 cm/s.
Although percentile curves are useful in routine clinical practice for comparing age-dependent measurements with normal ranges, as a statistical method they represent a challenge because of the statistical variance within the reference cohort, which can result in the distribution appearing irregular. This then has to be compensated for by smoothing the curve.
The discrepancies between different reference curves and the practical problem of offering recommendations in guidelines prompted us to create our own reference curve for Doppler measurements of the UA based on a singleton cohort and obtained under standardized and feasible conditions.
Material and Methods
Study population
This retrospective cohort study was carried out in the Department of Obstetrics of the Charité – Universitätsmedizin Berlin, the Department of Obstetrics and Prenatal Medicine of the University Hospital Halle (Saale) and the Center for Prenatal Diagnostics and Human Genetics Kurfürstendamm 199. Ultrasound examinations of singleton pregnancies with Doppler measurement of the UA carried out from January 2000 to September 2016 (Charité), from January 2011 to September 2016 (Halle) and January 2008 and September 2016 (Center for Prenatal Diagnostics) were identified in the Viewpoint ultrasound reporting database (GE Healthcare, Solingen, Germany). The datasets examined in this retrospective analysis were obtained during routine screening without the women being targeted for intervention; the data was anonymized for further processing. Patients gave their written consent to the examination. Age of gestation was determined based on the date of the last menstruation or a previous ultrasound examination. To minimize any overrepresentation of pathological cases, e.g., because of repeated controls, only cases who underwent a maximum of three ultrasound examinations during the course of the pregnancy were included in the study.
Examinations were carried out using the ultrasound systems Accuvix V20, A30 or WS80A (Samsung Medison, Seoul, Republic of Korea), Philips iU22 or Epiq 7W (Koninklijke Philips Electronics N. V., Eindhoven, The Netherlands) and Voluson E8 or E10 (General Electric Healthcare, Milwaukee, WI, USA). All examinations were done by experienced DEGUM-certified ultrasound specialists.
After determining the course of the UA, resistance in the UA is routinely measured transabdominally on the ascending branch of the UA proximal to crossing the external iliac artery. The insonation angle to the artery should be less than 60° and the maximum systolic blood flow velocity should be at least 60 cm/s ([Fig. 1]).

If the UA branches out prior to crossing the external iliac artery, measurements obtained for the uterine branch with the higher flow velocity were used.
The pulsed Doppler gate was positioned proximal to the crossing. The signal was then activated until three consecutive waveforms were obtained. The PI of the left and right artery was determined and used to calculate the mean of both values (Mean PI).
Statistical analysis
Pregnancy-specific percentile curves were generated using the LMS Chartmaker Pro software (v2.54, The Institute of Child Health, London, United Kingdom). Coleʼs Lambda, Mu, and Sigma (LMS) method [12] was used to create the curves. The starting point was the generation of three auxiliary curves to show the skew (L for Lambda), the median (M for µ) and the coefficient of variation (S for Sigma). The three curves were then approximated and smoothed.
Skew reveals the power of the Box-Cox transformation which adjusts the distribution of data by stabilizing the variance. “Penalized likelihood” and “Akaike Information Criterion (AIC)” methods were employed to adjust the three curves using non-linear regression with cubic splines. The extent of smoothing was determined in equivalent degrees of freedom (edf) for each L, M, and S curve.
If these parameters are known and it can be assumed that values are normally distributed, it is possible to calculate any required percentile.
The Q test was used to validate the model; it was optimized where necessary by adjusting the edf of L, M and S [13]. The percentiles for P5, P50 and P95 were calculated and plotted as smoothed curves.
Analysis of variance of the measurements of the Mean PI was done for the 22nd–24th weeks of gestation.
Statistical analysis was done using GraphPad Prism, version 6.0 (GraphPad Software, San Diego, CA, USA) and JMP 12 for Macintosh (SAS Institute Inc., Cary, NC, USA, www.jmp.com).
Results
Data analysis
During the investigated period (January 2000 to September 2016 [Charité], January 2011 to September 2016 [Halle], and January 2008 and September 2016 [Center for Prenatal Diagnostics]) a total of 104 208 Doppler examinations of the UA in singleton pregnancies from the 11th week of gestation were identified (Charité: 20 393; Halle: 3271; Center for Prenatal Diagnostics: 80 544). In 103 720 cases, data were available for both the left and right UA (99.53%). Of these, 17 249 examinations were done during the first trimester screening (11 + 0 to 13 + 6 week of gestation) and 54 143 examinations between the 22nd and 24th week of gestation (GW) ([Fig. 2]).

Statistical analysis
The obtained values were analyzed using the LMS method. Each L, M, and S curve was smoothed and the 5th, 50th and 95th percentiles were calculated.
The graph in [Fig. 3] shows the 5th, 50th and 95th percentiles in relation to the week of gestation at the time of examination. Median values decreased till the 22nd GW after which values plateaued until about the 27th week of gestation. Median values showed a negative trend over the course of pregnancy, which corresponded to a weekly decline in Mean PI of around 0.026.
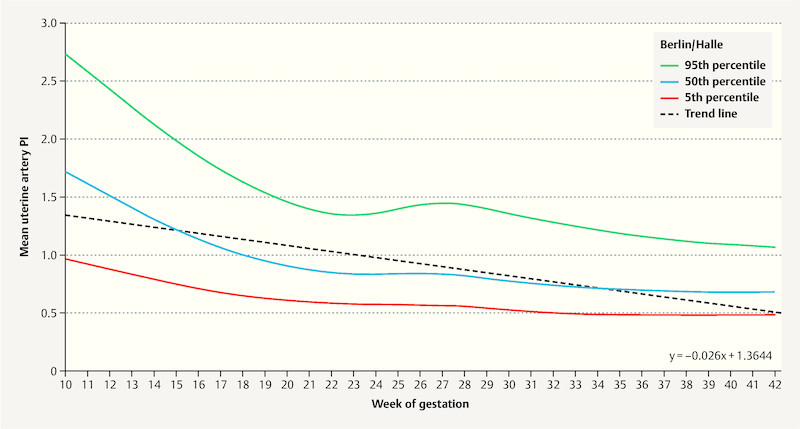
Interestingly, the 95th percentiles changed during this period from a Mean PI of 1.35 in the 22nd week of gestation to around 1.44 in week 27. This effect was also found when the datasets were analyzed separately according to study location (not shown here). [Table 1] shows the results grouped according to the week of gestation.
|
GW |
5th percentile |
50th percentile |
95th percentile |
|---|---|---|---|
|
10 |
0.96 |
1.71 |
2.72 |
|
11 |
0.92 |
1.60 |
2.57 |
|
12 |
0.88 |
1.50 |
2.41 |
|
13 |
0.83 |
1.40 |
2.26 |
|
14 |
0.79 |
1.30 |
2.11 |
|
15 |
0.74 |
1.21 |
1.97 |
|
16 |
0.71 |
1.13 |
1.84 |
|
17 |
0.67 |
1.06 |
1.72 |
|
18 |
0.64 |
0.99 |
1.62 |
|
19 |
0.62 |
0.94 |
1.53 |
|
20 |
0.60 |
0.90 |
1.45 |
|
21 |
0.59 |
0.87 |
1.39 |
|
22 |
0.58 |
0.85 |
1.35 |
|
23 |
0.57 |
0.83 |
1.34 |
|
24 |
0.57 |
0.83 |
1.36 |
|
25 |
0.57 |
0.84 |
1.40 |
|
26 |
0.57 |
0.84 |
1.43 |
|
27 |
0.56 |
0.83 |
1.44 |
|
28 |
0.55 |
0.82 |
1.43 |
|
29 |
0.54 |
0.79 |
1.40 |
|
30 |
0.52 |
0.77 |
1.35 |
|
31 |
0.51 |
0.75 |
1.31 |
|
32 |
0.50 |
0.74 |
1.28 |
|
33 |
0.49 |
0.72 |
1.25 |
|
34 |
0.49 |
0.71 |
1.21 |
|
35 |
0.48 |
0.70 |
1.18 |
|
36 |
0.48 |
0.69 |
1.16 |
|
37 |
0.48 |
0.69 |
1.14 |
|
38 |
0.48 |
0.68 |
1.12 |
|
39 |
0.48 |
0.68 |
1.10 |
|
40 |
0.48 |
0.68 |
1.09 |
|
41 |
0.48 |
0.68 |
1.08 |
|
42 |
0.49 |
0.68 |
1.06 |
Discussion
This study analyzed the mean pulsatility index of the UA obtained from around 104 000 Doppler examinations of singleton pregnancies. Doppler sonography has been used in obstetrics to investigate the UA for more than 30 years.
The association between increased resistance in the UA and an increased risk of various complications of pregnancy (IUGR, premature placental abruption, perinatal death) is well known.
Dugoff and colleagues were able to show an association between increased Doppler values and developing intrauterine growth restriction in the first trimester of pregnancy. Women with a mean resistance index (mean RI) above the 75th percentile had an almost 5.5 × higher risk of fetal IUGR (95% CI 1.6 – 18.7) [14].
The value of Doppler sonography of the UA for predicting preeclampsia was investigated in a review article by Cnossen and colleagues [15], which evaluated 74 studies with around 80 000 pregnant women. Cnossen et al. postulated that the prediction of preeclampsia based on Doppler examination of the UA was easier in the second trimester of pregnancy compared to the first. In women with a low risk of developing preeclampsia, increased uterine artery PI with notching was the best predictor of overall risk (sensitivity 23%, specificity 99%, positive likelihood ratio [+LR] 7.5, negative likelihood ratio [−LR] 0.59). Increased PI was the best predictor of severe preeclampsia (sensitivity 78%, specificity 95%, positive likelihood ratio [+LR] 15.6, negative likelihood ratio [−LR] 0.23) or bilateral notching (sensitivity 65%, specificity 95%, positive likelihood ratio [+LR] 13.4, negative likelihood ratio [−LR] 0.37).
In a high-risk collective, increased PI with notching was useful for assessing overall risk (sensitivity 19%, specificity 99%, positive likelihood ratio [+LR] 21, negative likelihood ratio [−LR] 0.82). In this group, an increased resistance index (RI) was the best indicator for the risk of severe preeclampsia (sensitivity 80%, specificity 78%, positive likelihood ratio [+LR] 3.7, negative likelihood ratio [−LR] 0.26).
Other factors apart from trophoblast invasion also influence uterine blood flow. Additional factors include physical activity [16], local anesthesia [17] but also the location of the placenta [18].
Placental location also appears to be a co-factor in developing intrauterine growth restriction. Kalanithi et al. reported that location of the placenta on one of the side walls was almost 4 × more common in pregnancies with IUGR (OR 3.8; 95% CI 1.3 – 11.2) [19].
This is why it is particularly important to always investigate both uterine arteries and to calculate the average of both findings for the assessment.
The site where the Doppler probe is placed also affects the outcomes. If it is placed near the cervix, i.e. proximally, values will be higher than those obtained from more distal sites [8].
Nicolaides determined that the standard site of measurement during examinations carried out as part of first trimester screening should be in the paracervical region on the main branch of the UA [10].
After the start of the second trimester of pregnancy, the authors of the international guidelines of the ISUOG recommend measuring the PI of the UA proximal to crossing the external iliac artery [9]. The reference curve of Papageorghiou should be used if measurement is done vaginally, [10] and the reference curve of Gomez should be used for abdominal measurements [11].
But even from a practical point of view, this approach which uses two different reference curves to assess uterine vascular resistance is not useful. Matters are made even more complicated by the fact that the guideline recommends a proximal UA measurement site in the first trimester of pregnancy, irrespective of whether measurement is done transvaginally or abdominally (i.e. in the area covered by the Papageorghiou reference curves) but suggests that findings should be evaluated using the Gomez curve.
Things become even more complicated if the UA branches out near the point where it crosses the external iliac artery. To be consistent, if the UA branches out, measurements would have to be taken prior to the point where the UA crosses the external iliac artery, i.e. just distal to the crossing and prior to the branching, and it would be necessary to use the reference curves of Gomez as these were purportedly generated from measurements taken distal to the crossing of arteries [11].
If, however, the UA branches out proximal to its crossing of the external iliac artery, then resistance in the UA should be measured proximal to this branching of the UA and in the vicinity of the cervix, and the standard curve of Papageorghiou should be used for evaluation as the data on UA resistance was collected from sites near the cervix along the main branch of the uterine vaginal artery [10].
In view of the known decline in PI as the probe is moved distally, it would be expected that the median of the Gomez curve (where data are obtained distal to the crossing of arteries) would be lower than that of the curve of Papageorghiou. But this is not the case as the values for both curves are almost identical (22nd GW: Gomez, median: 1.00; 95th percentile: 1.47; Papageorghiou, median: 1.04; 95th percentile: 1.63). This casts doubts on the statement that the Gomez curves really were generated from measurements of uterine resistance taken distal to the crossing of the UA and the external iliac artery.
A look at our data shows that up until the third trimester the median of our data is lower than that of the Gomez curve, even though data were obtained from proximal sites ([Fig. 4]).

Evaluation of the data of our cohort also showed flattening of the median curve with broadening of the inter-percentile range (i.e. between the 5th and the 95th percentiles) between the 23rd and 27th week of gestation. One possible explanation for this finding would suggest that the broadening was due to overrepresentation of Doppler controls after measurements showed increased resistance when the women were examined to get a more precise diagnosis. We were able to counteract this effect by only including pregnant women in the study who had a maximum of three Doppler ultrasounds over the course of their pregnancy. What also mediates against this explanation is that this effect was also detectable when each of the three study locations was analyzed separately. The most probable explanation is that this broadening was due to distribution, because around 75% of measured PI values were less than 1 (median: 0.795; 75th percentile: 0.98; [Fig. 5]).

A comparison of our data with the data of Papageorghiou showed, as expected, a shift to lower mean pulsatility indices between the 22nd and 24th GW (median: 0.84; 95th percentile: 1.34; [Fig. 6]).

In our working groups, uterine vascular resistance is measured both transabdominally and transvaginally in the paracervical region proximal to the crossing of the UA. If the UA has already branched out in this section, which occurs less frequently than when measurements are taken distal to the crossing, we used the figure obtained for the uterine branch with the higher flow velocity.
As far as we know, this study is one of the biggest evaluations carried out to generate reference curves for the mean UA pulsatility index. The strengths of the study are its sample size of almost 104 000 Doppler examinations and the high quality of the measurement results, as only examinations carried out by experienced and certified ultrasound specialists were included in the study.
The latter is particularly important as the investigatorʼs experience affects the validity of the examination and thus can even affect pregnancy outcomes. A study by Gardosi et al. reported that after the introduction of a training and accreditation program to identify pregnancies with intrauterine growth retardation, the number of stillbirths dropped significantly [20].
Nevertheless, our study also has its limitations. It was a retrospective study which meant that there was only a limited extent to which co-variables could be taken into account. Moreover, despite the large number of cases included in the study, it is not possible to exclude selection bias as the cases all came from limited regional cohorts and the study centers are facilities which specialize in the diagnosis and treatment of difficult pregnancies and therefore receive physician-referred patients. But we were able to reduce the impact of this effect by excluding multiple pregnancies and pregnancies which required more than three ultrasound examinations during the course of pregnancy as it was assumed that patients who had more ultrasound examinations required above-average monitoring because of potential pathologies.
Conclusion
The mean pulsatility index (Mean PI) of our reference curve showed a continuous decrease over the course of pregnancy. There were significant differences compared to other alternative reference curves, which were most likely due to the method used to capture the signals. A system of classifying Doppler studies and a reference curve adapted to the current technology are urgently required to differentiate better between physiological and pathological findings. Our data confirm the need for prospective studies to obtain further insights and allow the risks for affected pregnancies to be assessed better.
Conflict of Interest/Interessenkonflikt
The authors declare that they have no conflict of interest.
Die Autoren geben an, dass kein Interessenkonflikt besteht.
Acknowledgement
We would like to thank the staff of the study centers for providing the data.
-
References/Literatur
- 1 Robertson WB, Brosens I, Dixon G. Uteroplacental vascular pathology. Eur J Obstet Gynecol Reprod Biol 1975; 5: 47-65
- 2 Lin S, Shimizu I, Suehara N. et al. Uterine artery Doppler velocimetry in relation to trophoblast migration into the myometrium of the placental bed. Obstet Gynecol 1995; 85: 760-765
- 3 Khong TY, De Wolf F, Robertson WB. et al. Inadequate maternal vascular response to placentation in pregnancies complicated by pre-eclampsia and by small-for-gestational age infants. Br J Obstet Gynaecol 1986; 93: 1049-1059
- 4 Papageorghiou AT, Yu CK, Nicolaides KH. The role of uterine artery Doppler in predicting adverse pregnancy outcome. Best Pract Res Clin Obstet Gynaecol 2004; 18: 383-396
- 5 Poon LC, Volpe N, Muto B. et al. Second-trimester uterine artery Doppler in the prediction of stillbirths. Fetal Diagn Ther 2013; 33: 28-35
- 6 Matijevic R, Johnston T. In vivo assessment of failed trophoblastic invasion of the spiral arteries in pre-eclampsia. Br J Obstet Gynaecol 1999; 106: 78-82
- 7 Harrington K, Cooper D, Lees C. et al. Doppler ultrasound of the uterine arteries: the importance of bilateral notching in the prediction of pre-eclampsia, placental abruption or delivery of a small-for-gestational-age baby. Ultrasound Obstet Gynecol 1996; 7: 182-188
- 8 Entezami M, Hagen A, Albig M. Uteriner Doppler – der Messpunkt entscheidet!. Z Geburtshilfe Neonatol 2009; 213: PO_G_01_07
- 9 Bhide A, Acharya G, Bilardo CM. et al. ISUOG practice guidelines: use of Doppler ultrasonography in obstetrics. Ultrasound Obstet Gynecol 2013; 41: 233-239
- 10 Papageorghiou AT, Yu CK, Bindra R. et al. Multicenter screening for pre-eclampsia and fetal growth restriction by transvaginal uterine artery Doppler at 23 weeks of gestation. Ultrasound Obstet Gynecol 2001; 18: 441-449
- 11 Gómez O, Figueras F, Fernández S. et al. Reference ranges for uterine artery mean pulsatility index at 11–41 weeks of gestation. Ultrasound Obstet Gynecol 2008; 32: 128-132
- 12 Cole TJ. The LMS method for constructing normalized growth standards. Eur J Clin Nutr 1990; 44: 45-60
- 13 Pan H, Cole TJ. A comparison of goodness of fit tests for age-related reference ranges. Stat Med 2004; 23: 1749-1765
- 14 Dugoff L, Lynch AM, Cioffi-Ragan D. et al. First trimester uterine artery Doppler abnormalities predict subsequent intrauterine growth restriction. Am J Obstet Gynecol 2005; 193: 1208-1212
- 15 Cnossen JS, Morris RK, ter Riet G. et al. Use of uterine artery Doppler ultrasonography to predict pre-eclampsia and intrauterine growth restriction: a systematic review and bivariable meta-analysis. CMAJ 2008; 178: 701-711
- 16 Jeffreys RM, Stepanchak W, Lopez B. et al. Uterine blood flow during supine rest and exercise after 28 weeks of gestation. BJOG 2006; 113: 1239-1247
- 17 Guedes-Martins L, Graça H, Saraiva JP. et al. The effects of spinal anaesthesia for elective caesarean section on uterine and umbilical arterial pulsatility indexes in normotensive and chronic hypertensive pregnant women: a prospective, longitudinal study. BMC Pregnancy Childbirth 2014; 14: 1-10
- 18 Kofinas AD, Penry M, Greiss jr. FC. et al. The effect of placental location on uterine artery flow velocity waveforms. Am J Obstet Gynecol 1988; 159: 1504-1508
- 19 Kalanithi LE, Illuzzi JL, Nossov VB. et al. Intrauterine growth restriction and placental location. J Ultrasound Med 2007; 26: 1481-1489
- 20 Gardosi J, Giddings S, Clifford S. et al. Association between reduced stillbirth rates in England and regional uptake of accreditation training in customised fetal growth assessment. BMJ Open 2013; 3: e003942
Correspondence/Korrespondenzadresse
-
References/Literatur
- 1 Robertson WB, Brosens I, Dixon G. Uteroplacental vascular pathology. Eur J Obstet Gynecol Reprod Biol 1975; 5: 47-65
- 2 Lin S, Shimizu I, Suehara N. et al. Uterine artery Doppler velocimetry in relation to trophoblast migration into the myometrium of the placental bed. Obstet Gynecol 1995; 85: 760-765
- 3 Khong TY, De Wolf F, Robertson WB. et al. Inadequate maternal vascular response to placentation in pregnancies complicated by pre-eclampsia and by small-for-gestational age infants. Br J Obstet Gynaecol 1986; 93: 1049-1059
- 4 Papageorghiou AT, Yu CK, Nicolaides KH. The role of uterine artery Doppler in predicting adverse pregnancy outcome. Best Pract Res Clin Obstet Gynaecol 2004; 18: 383-396
- 5 Poon LC, Volpe N, Muto B. et al. Second-trimester uterine artery Doppler in the prediction of stillbirths. Fetal Diagn Ther 2013; 33: 28-35
- 6 Matijevic R, Johnston T. In vivo assessment of failed trophoblastic invasion of the spiral arteries in pre-eclampsia. Br J Obstet Gynaecol 1999; 106: 78-82
- 7 Harrington K, Cooper D, Lees C. et al. Doppler ultrasound of the uterine arteries: the importance of bilateral notching in the prediction of pre-eclampsia, placental abruption or delivery of a small-for-gestational-age baby. Ultrasound Obstet Gynecol 1996; 7: 182-188
- 8 Entezami M, Hagen A, Albig M. Uteriner Doppler – der Messpunkt entscheidet!. Z Geburtshilfe Neonatol 2009; 213: PO_G_01_07
- 9 Bhide A, Acharya G, Bilardo CM. et al. ISUOG practice guidelines: use of Doppler ultrasonography in obstetrics. Ultrasound Obstet Gynecol 2013; 41: 233-239
- 10 Papageorghiou AT, Yu CK, Bindra R. et al. Multicenter screening for pre-eclampsia and fetal growth restriction by transvaginal uterine artery Doppler at 23 weeks of gestation. Ultrasound Obstet Gynecol 2001; 18: 441-449
- 11 Gómez O, Figueras F, Fernández S. et al. Reference ranges for uterine artery mean pulsatility index at 11–41 weeks of gestation. Ultrasound Obstet Gynecol 2008; 32: 128-132
- 12 Cole TJ. The LMS method for constructing normalized growth standards. Eur J Clin Nutr 1990; 44: 45-60
- 13 Pan H, Cole TJ. A comparison of goodness of fit tests for age-related reference ranges. Stat Med 2004; 23: 1749-1765
- 14 Dugoff L, Lynch AM, Cioffi-Ragan D. et al. First trimester uterine artery Doppler abnormalities predict subsequent intrauterine growth restriction. Am J Obstet Gynecol 2005; 193: 1208-1212
- 15 Cnossen JS, Morris RK, ter Riet G. et al. Use of uterine artery Doppler ultrasonography to predict pre-eclampsia and intrauterine growth restriction: a systematic review and bivariable meta-analysis. CMAJ 2008; 178: 701-711
- 16 Jeffreys RM, Stepanchak W, Lopez B. et al. Uterine blood flow during supine rest and exercise after 28 weeks of gestation. BJOG 2006; 113: 1239-1247
- 17 Guedes-Martins L, Graça H, Saraiva JP. et al. The effects of spinal anaesthesia for elective caesarean section on uterine and umbilical arterial pulsatility indexes in normotensive and chronic hypertensive pregnant women: a prospective, longitudinal study. BMC Pregnancy Childbirth 2014; 14: 1-10
- 18 Kofinas AD, Penry M, Greiss jr. FC. et al. The effect of placental location on uterine artery flow velocity waveforms. Am J Obstet Gynecol 1988; 159: 1504-1508
- 19 Kalanithi LE, Illuzzi JL, Nossov VB. et al. Intrauterine growth restriction and placental location. J Ultrasound Med 2007; 26: 1481-1489
- 20 Gardosi J, Giddings S, Clifford S. et al. Association between reduced stillbirth rates in England and regional uptake of accreditation training in customised fetal growth assessment. BMJ Open 2013; 3: e003942


