

Subscribe to RSS
DOI: 10.1055/s-0044-1787696
Evaluation of Microstrain in the Regions Surrounding Morse Taper and External Hexagon Implants
Authors

Abstract
Objective The aim of this study was to compare the Morse taper (MT) + titanium base (Ti-Base) abutment with the external hexagon (EH) + Ti-Base abutment by using the strain gauge method in the mesial, distal, and apical–buccal areas around these types of implants.
Materials and Methods This study investigated two groups, MT and EH, each comprising five polyurethane samples with a dental implant (3.75 × 11.5 mm) in the area of artificial tooth 15. The strain gauges were glued to the mesial, distal, and apical–buccal polyurethane areas of all samples in relation to the implant. Ti-Base nonangled abutments were installed on the implants in each group. Ten identical zirconia crowns were constructed by scanning and milling and were subsequently cemented onto the Ti-base abutments with calcium hydroxide cement. Then, an axial load of 100 N was applied to the occlusal region of the zirconia crowns, and strain gauge measurements were taken.
Statistical Analysis Strain gauge data were assessed by a two-way analysis of variance (ANOVA) with “implant connection” and “strain gauge position” factors, followed by the Bonferroni test (p < 0.05).
Results The MT group showed significantly lower microstrain values in the mesial and apical strain gauges compared to the EH group.
Conclusion The MT group exhibited less microstrain in the mesial and apical areas of the polyurethane samples near the implant. Consequently, the MT connection was considered more biomechanically advantageous.
Keywords
strain gauge measurements - dental implant - external hexagon - morse taper - Ti-Base abutment - microstrainIntroduction
Dental implants and prostheses on implants are the gold standard treatment for partially or totally edentulous patients.[1] [2] This type of treatment has grown in popularity because, unlike other treatment options, it preserves the adjacent tooth and bone structures.[3] In terms of revenue, the global dental implants and prosthetics market was estimated to be worth $10.4 billion in 2023, and is expected to rise in value to $16 billion by 2029, representing a 7.5% compound annual growth rate over this period.[4] This market growth is directly related to the global aging population, as the risk of tooth loss increases with age.[1] [3]
Morse taper (MT) and external hexagon (EH) connections are widely used in dentistry.[2] [5] MT is an internal connection at a conic angle of 8, 11, or 16 degrees.[5] This connection is created by “a cone within a cone,” which generates a mechanical lock and is strengthened by a screw retention system.[5] Following implant placement, the MT platform is often located 1 to 2 mm below the bone crest,[6] which can improve gingival conditioning and aesthetics of the region.[7] [8] In contrast, the EH connection is external, with the abutment fitting over the 0.7 mm-high hexagon of the implant, and the fixation between them is exclusively through screwing.[5] After implant installation, the EH platform is often located at the bone crest level.[8] [9] It is worth noting that the MT connection leaves a space between the alveolar bone and the implant–abutment union, whereas the EH connection does not. Furthermore, MT results in a more effective seal than EH.[2] [5] [10]
In the field of oral rehabilitation, digital workflow reduces work time and creates high-precision prosthetic restorations.[11] This method associates intraoral scanning with the computer-aided design/computer-aided manufacturing (CAD/CAM) system.[11] CAD/CAM-compatible titanium base (Ti-Base) abutments have been used as a platform to mill customized ceramic prostheses.[11] [12] After being milled and sintered, the restoration is cemented to the Ti-Base abutment outside the mouth, which is then screwed to the dental implant (hybrid-abutment prosthesis).[11] [12] The advantages of this hybrid-abutment prosthesis concept include aesthetics, the absence of ceramic material at the level of the implant–abutment connection, and a cementation procedure under controlled environmental conditions (outside the mouth), which also facilitates the removal of excess cement (improved biomechanical performance).[11] [12]
The strain gauge method is used in vitro to evaluate the microdeformation of structures.[12] According to Goiato et al[13]:
“Strain gauges are small electrical resistances that, on undergoing minimal deformation, alter the resistance created to the low-intensity current that runs through them and measure the deformation undergone by the object to which they are applied. The electrical signal captured is sent to a data acquisition board to be transformed into a digital signal, enabling it to be read on a computer. These small extensometry terminals have the capacity to record, with great precision, any deformation that occurs when they are submitted to the action of a stress. Strain gauges may be used to assess stresses in prostheses, implants, and teeth.”
A PubMed search combining the keywords “extensometry” and “Ti-Base” or “strain gauge” and “Ti-Base” or “extensometry” and “Morse taper” and “external hexagon” or “strain gauge” and “Morse taper” and “external hexagon” did not reveal articles comparing MT/Ti-Base with EH/Ti-Base using the strain gauge measurement method. Thus, the objective of this study was to compare the MT + Ti-Base abutment with the EH + Ti-Base abutment by using the strain gauge method in the mesial, distal, and apical–buccal areas around these types of implants.
Materials and Methods
Groups
The study consisted of two groups, each with a different connection system, and included five polyurethane samples (F160 AXSON, Brazil)[2]:
-
EH group: Each polyurethane sample consisted of one EH implant (HE TI BIOFIT, DSP, Brazil) along with one nonangled Ti-Base abutment measuring 5.0 × 4.7 mm (base height: 1.0 mm) (Ti-Base Standard HE, DSP, Brazil) and a single zirconia crown.
-
MT group: Each polyurethane sample consisted of one MT implant (CMi, DSP, Brazil) along with one non-angled Ti-base abutment measuring 5.0 × 4.7 mm (base height: 1.5 mm) (Ti-Base Standard CMi, DSP, Brazil) and a single zirconia crown.
The implants in both groups shared identical dimensions (3.75 × 11.5 mm), external design, and surface treatment, and were manufactured with the same type of metal.
Sample Manufacturing
We used a dental manikin (PD100 Top Dentística, Pronew, Brazil) missing artificial tooth 15 to manufacture 10 polyurethane samples (F160 AXSON, Brazil).
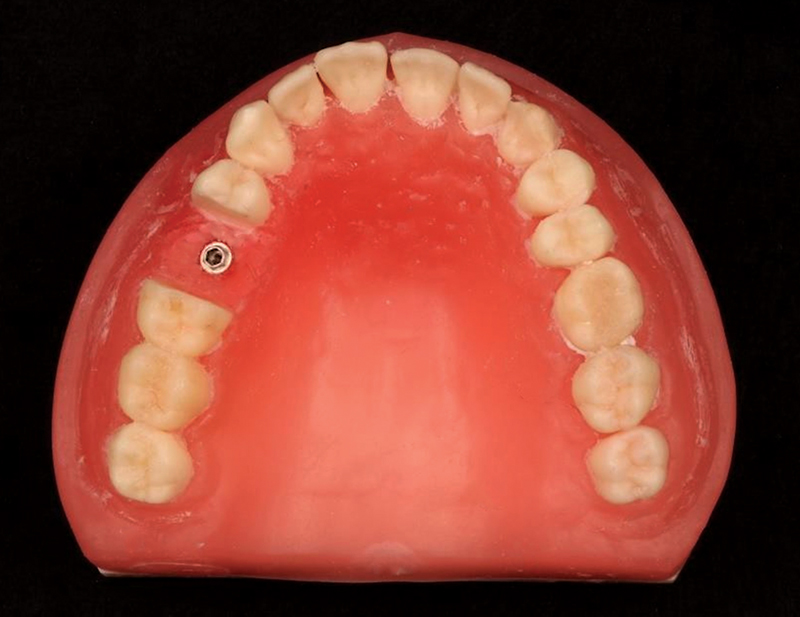
Initially, with the aid of a dental surveyor, the EH implant was positioned in the edentulous area of the dental manikin and later fixed with a self-polymerizing acrylic resin (Pattern Resin LS, GC, United States). To position the implant in the edentulous area, it was first screwed to the screw of its open tray transfer (DSP, Brazil); then, the transfer screw was screwed to the dental surveyor; and, finally, the implant was positioned in the edentulous area using the dental surveyor. The use of a surveyor was necessary to standardize the position of inclusion of each type of implant in the manikin, which was slightly mesialized to reflect the natural tooth inclination (second premolar of the maxilla).[14] The inclination of the implant was similar to that of the first premolar of the maxillary manikin. After positioning the EH implant in the edentulous area, acrylic resin increments were placed around the implant to fix it to the manikin. The screw of the open tray transfer (DSP, Brazil) was released from the surveyor following acrylic resin polymerization. A wax layer (Wilson, Brazil) was applied to the acrylic resin to obtain the final finish on the edentulous surface ([Fig. 1]). The EH implant platform was placed at the wax level. Then, transfer molding was performed using silicone (SIQMOL, SIQUIPLÁS, Brazil) ([Fig. 2]). After silicone polymerization, the mold was separated from the manikin by unscrewing the open tray transfer. A new EH implant (HE TI BIOFIT, DSP, Brazil) was screwed onto the transfer retained in the silicone mold. Subsequently, the F160 polyurethane resin (F160 AXSON, Brazil)[2] [15] was manipulated and poured into a silicone mold according to the manufacturer's recommendations. The polyurethane resin was polymerized, then the transfer was removed and the sample was detached from the silicone mold. All the polyurethane samples from the EH group were manufactured using the same mold. The same procedure was repeated for the MT group, but the MT platform was positioned and fixed 1 mm below the wax level.

The mesial, distal, and apical–buccal polyurethane areas relative to the implant were cleaned with absolute alcohol and dried. Strain gauges (PA06060BA, Excel Sensors Ind. Com. Exp. Ltd., Brazil) already tested on a voltmeter (350 µV) were glued onto these areas with cyanoacrylate ([Fig. 3]). After drying the cyanoacrylate, the strain gauges were tested again using a voltmeter at the same voltage. The strain gauges were then isolated with a hot-melt adhesive (TRAMONTINA, Brazil) using a hot glue gun ([Fig. 3]).

Manufacture of the Single-Unit Crowns
A scan body (DSP, Brazil) was screwed onto the EH implant placed in the manikin and scanned (SC3600 Scanner, Carestream, United States; [Fig. 4]). The scanned images were used by the dental laboratory to plan the full zirconia crown for cementation onto a Ti-Base abutment. Planning was performed using EXOCAD software (Exocad, Germany). The Ti-Base abutment used for both the EH and MT implants had the same external design and dimensions, meaning a single design was used to mill 10 identical zirconia crowns (Protmat, Brazil). Thus, a crown-manufacturing project created for the EH group was used for the MT group. Next, InlabCAM software (Dentsply Sirona, United States) and an MCX5 milling machine (Dentsply Sirona, United States) were used. After milling, the zirconia crowns were sintered in an oven (InLab Profire Sirona). The crown was made with slight mesialization, similar to that of the first premolar of the maxillary manikin.[14]

Ti-Base Abutment Installation and Zirconia Crown Cementation
The Ti-Base abutments were screwed to their respective implants in the polyurethane samples using the 30 Ncm torque recommended by the manufacturer. The Ti-Base abutments and the interior part of the zirconia crowns were subsequently cleaned with 70% alcohol and dried. Zirconia crowns were cemented to the abutments with calcium hydroxide cement (Hydro C, Dentsply Sirona, United States), following the manufacturer's recommendations. Immediately after cementation, a load of 5 kg was applied to the crowns for 5 minutes. Cement hardening occurred when this load held the crowns in position ([Fig. 5]).

Strain Gauge Measurements
A 100 N axial load was applied to the center of the occlusal surface of each sample using a universal testing machine (EMIC DL-3000, Brazil; [Fig. 6]).[2] The strain gauges were configured into a one-quarter Wheatstone bridge and the data were transferred through a data acquisition system (ADS2000, Lynx Tecnologia Eletrônica Ltd., Brazil) and processed by specific software (AqDados 7, Lynx, Brazil).[2] Strain was tested five times on each sample to obtain a mean value in microstrain. The tests were conducted when the microstrain values were zero, indicating the absence of plastic strain.[2]

Statistical Analysis
All statistical analyses were performed using the Jamovi software (version 2.2.5.0; Jamovi Project, Australia). The Shapiro–Wilk test was used to assess data normality. Strain gauge data were assessed by a two-way analysis of variance (ANOVA) with “implant connection” and “strain gauge position” factors, followed by the Bonferroni test (p < 0.05).
Results
All factors evaluated were statistically significant according to the two-way ANOVA test ([Table 1]). [Graph 1] and [Table 2] show that the EH group exhibited significantly higher microstrain values than the MT group at the mesial and apical positions. In the EH group, the mesial strain gauge showed a significantly higher microstrain value than those in the other positions, and the distal strain gauge showed a significantly higher microstrain value than that in the apical position. In the MT group, the mesial or distal strain gauges showed a significantly higher microstrain value than that in the apical position. As shown in [Graph 2], the EH group exhibited a significantly higher microstrain than the MT group based only on the type of connection.
|
Source |
Type III sum of squares |
df |
Mean square |
F |
Significance |
|
Corrected model |
127,927.251a |
9 |
14,214.139 |
284.261 |
0.000[a] |
|
Intercept |
1,272,953.724 |
1 |
1,272,953.724 |
25,457.103 |
0.000[a] |
|
Position |
54,079.392 |
4 |
13,519.848 |
270.376 |
0.000[a] |
|
Connection |
44,065.898 |
1 |
44,065.898 |
881.250 |
0.000[a] |
|
Position × connection |
29,781.961 |
4 |
7,445.490 |
148.898 |
0.000[a] |
|
Error |
2,000.155 |
40 |
50.004 |
||
|
Total |
1,402,881.130 |
50 |
a Statistical significance (p < 0.05).
Abbreviations: EH, external hexagon; MT, Morse taper.
Note: Bonferroni's test, p < 0.05. Different capital letters in the vertical columns for the same group (EH or MT) represent a statistically significant difference. Different lowercase letters in the horizontal rows for the same strain gauge position (mesial, distal, or apical–buccal) represent a statistically significant difference.


In both groups, there were no mechanical complications after applying a force of 100 N to the samples, such as screw loosening or fractures.
Discussion
In this study, the mean mesial and distal microstrain values were significantly higher than the apical values in both the EH and MT groups. This may have occurred because the axial force applied to the occlusal region of the crowns was closer to the implant platforms than to their apices ([Table 2] and [Graph 1]). Notably, the apical microstrain was significantly lower in the MT group than in the EH group. This suggests that the MT connection more effectively dissipated stress toward the implant apex, resulting in a significantly lower level of microstrain in the apical-buccal polyurethane area.
Okeson stated that the natural maxillary premolars are slightly mesially inclined.[14] In the present study, implants and crowns followed this principle and, when associated with the characteristics of the EH connection,[2] [5] this may explain the significantly higher levels of mesial microstrain compared to distal microstrain in the EH group ([Table 2] and [Graph 1]). It is possible to consider this explanation when observing the absence of significant difference between the values of the mesial and distal strain gauges in the MT group. It is also noteworthy that the mesial microstrain in the MT group was significantly lower than that in the EH group. This suggests that the MT connection likely dissipated more stress than the EH connection, leading to a significantly lower level of microstrain in the mesial polyurethane area. This indicated that this internal connection was not influenced by a slight mesial inclination of the implant and crown. The characteristics of the MT connections may explain this result.[2] [5]
From a biomechanical standpoint, a significantly lower microstrain value around the implant platform may suggest less bone resorption in this region over time,[2] [16] which is crucial for ensuring implant stability and survival, particularly for short implants.[16] Additionally, bone maintenance plays a vital role in maintaining aesthetics. The positioning of the implant 1 mm below the polyurethane crest may also have decreased the mesial microstrain in the MT group. However, a study comparing microstrain at different depths of MT implant installations is needed to confirm this hypothesis.
The primary limitation of this study is the absence of a comparison between different abutments. Furthermore, future studies need to be conducted to test the samples using oblique forces.
Conclusion
The MT group exhibited less microstrain in the mesial and apical areas of the polyurethane samples close to the implant. Consequently, the MT connection was considered more biomechanically advantageous.
Conflict of Interest
None declared.
-
References
- 1 Semenzin Rodrigues A, de Moraes Melo Neto CL, Santos Januzzi M, Dos Santos DM, Goiato MC. Correlation between Periotest value and implant stability quotient: a systematic review. Biomed Tech (Berl) 2023; 69 (01) 1-10
- 2 Bittencourt AB, Rezende EO, Campaner M. et al. Stress distribution of multiple implant-supported prostheses: photoelastic and strain gauge analyses of external hexagon and morse taper connections. J Clin Exp Dent 2022; 14 (03) e235-e240
- 3 Elani HW, Starr JR, Da Silva JD, Gallucci GO. Trends in dental implant use in the U.S., 1999-2016, and projections to 2026. J Dent Res 2018; 97 (13) 1424-1430
- 4 Markets and Markets. Dental implants and prosthetics market [Internet]. Accesses May 29, 2024 at: https://www.marketsandmarkets.com/Market-Reports/dental-implants-prosthetics-market-695.html
- 5 Bittencourt ABBC, Neto CLMM, Penitente PA, Pellizzer EP, Dos Santos DM, Goiato MC. Comparison of the Morse cone connection with the internal hexagon and external hexagon connections based on microleakage: review. Prague Med Rep 2021; 122 (03) 181-190
- 6 Ellendula Y, Chandra Sekar A, Nalla S, Basany RB, Sailasri K, Thandu A. Biomechanical evaluation of stress distribution in equicrestal and sub-crestally placed, platform-switched morse taper dental implants in D3 bone: finite element analysis. Cureus 2022; 14 (04) e24591
- 7 Macedo JP, Pereira J, Vahey BR. et al. Morse taper dental implants and platform switching: the new paradigm in oral implantology. Eur J Dent 2016; 10 (01) 148-154
- 8 Palacios-Garzón N, Velasco-Ortega E, López-López J. Bone loss in implants placed at subcrestal and crestal level: a systematic review and meta-analysis. Materials (Basel) 2019; 12 (01) 154
- 9 Fernández-Domínguez M, Ortega-Asensio V, Fuentes-Numancia E. et al. Can the macrogeometry of dental implants influence guided bone regeneration in buccal bone defects? Histomorphometric and biomechanical analysis in beagle dogs. J Clin Med 2019; 8 (05) 618
- 10 Pereira J, Morsch CS, Henriques B. et al. Removal torque and biofilm accumulation at two dental implant-abutment joints after fatigue. Int J Oral Maxillofac Implants 2016; 31 (04) 813-819
- 11 TP Bergamo E, Zahoui A, Luri Amorin Ikejiri L. et al. Retention of zirconia crowns to Ti-base abutments: effect of luting protocol, abutment treatment and autoclave sterilization. J Prosthodont Res 2021; 65 (02) 171-175
- 12 Al-Thobity AM. Titanium base abutments in implant prosthodontics: a literature review. Eur J Dent 2022; 16 (01) 49-55
- 13 Goiato MC, Tonella BP, Ribeiro PdoP, Ferraço R, Pellizzer EP. Methods used for assessing stresses in buccomaxillary prostheses: photoelasticity, finite element technique, and extensometry. J Craniofac Surg 2009; 20 (02) 561-564
- 14 Okeson JP. Management of Temporomandibular Disorders and Occlusion. 8th ed. St. Louis, MO:: Elsevier; 2019
- 15 Nishioka RS, Nishioka LN, Abreu CW, de Vasconcellos LG, Balducci I. Machined and plastic copings in three-element prostheses with different types of implant-abutment joints: a strain gauge comparative analysis. J Appl Oral Sci 2010; 18 (03) 225-230
- 16 Sotto-Maior BS, Senna PM, da Silva-Neto JP, de Arruda Nóbilo MA, Del Bel Cury AA. Influence of crown-to-implant ratio on stress around single short-wide implants: a photoelastic stress analysis. J Prosthodont 2015; 24 (01) 52-56
Address for correspondence
Publication History
Article published online:
16 July 2024
© 2024. The Author(s). This is an open access article published by Thieme under the terms of the Creative Commons Attribution License, permitting unrestricted use, distribution, and reproduction so long as the original work is properly cited. (https://creativecommons.org/licenses/by/4.0/)
Thieme Medical and Scientific Publishers Pvt. Ltd.
A-12, 2nd Floor, Sector 2, Noida-201301 UP, India
-
References
- 1 Semenzin Rodrigues A, de Moraes Melo Neto CL, Santos Januzzi M, Dos Santos DM, Goiato MC. Correlation between Periotest value and implant stability quotient: a systematic review. Biomed Tech (Berl) 2023; 69 (01) 1-10
- 2 Bittencourt AB, Rezende EO, Campaner M. et al. Stress distribution of multiple implant-supported prostheses: photoelastic and strain gauge analyses of external hexagon and morse taper connections. J Clin Exp Dent 2022; 14 (03) e235-e240
- 3 Elani HW, Starr JR, Da Silva JD, Gallucci GO. Trends in dental implant use in the U.S., 1999-2016, and projections to 2026. J Dent Res 2018; 97 (13) 1424-1430
- 4 Markets and Markets. Dental implants and prosthetics market [Internet]. Accesses May 29, 2024 at: https://www.marketsandmarkets.com/Market-Reports/dental-implants-prosthetics-market-695.html
- 5 Bittencourt ABBC, Neto CLMM, Penitente PA, Pellizzer EP, Dos Santos DM, Goiato MC. Comparison of the Morse cone connection with the internal hexagon and external hexagon connections based on microleakage: review. Prague Med Rep 2021; 122 (03) 181-190
- 6 Ellendula Y, Chandra Sekar A, Nalla S, Basany RB, Sailasri K, Thandu A. Biomechanical evaluation of stress distribution in equicrestal and sub-crestally placed, platform-switched morse taper dental implants in D3 bone: finite element analysis. Cureus 2022; 14 (04) e24591
- 7 Macedo JP, Pereira J, Vahey BR. et al. Morse taper dental implants and platform switching: the new paradigm in oral implantology. Eur J Dent 2016; 10 (01) 148-154
- 8 Palacios-Garzón N, Velasco-Ortega E, López-López J. Bone loss in implants placed at subcrestal and crestal level: a systematic review and meta-analysis. Materials (Basel) 2019; 12 (01) 154
- 9 Fernández-Domínguez M, Ortega-Asensio V, Fuentes-Numancia E. et al. Can the macrogeometry of dental implants influence guided bone regeneration in buccal bone defects? Histomorphometric and biomechanical analysis in beagle dogs. J Clin Med 2019; 8 (05) 618
- 10 Pereira J, Morsch CS, Henriques B. et al. Removal torque and biofilm accumulation at two dental implant-abutment joints after fatigue. Int J Oral Maxillofac Implants 2016; 31 (04) 813-819
- 11 TP Bergamo E, Zahoui A, Luri Amorin Ikejiri L. et al. Retention of zirconia crowns to Ti-base abutments: effect of luting protocol, abutment treatment and autoclave sterilization. J Prosthodont Res 2021; 65 (02) 171-175
- 12 Al-Thobity AM. Titanium base abutments in implant prosthodontics: a literature review. Eur J Dent 2022; 16 (01) 49-55
- 13 Goiato MC, Tonella BP, Ribeiro PdoP, Ferraço R, Pellizzer EP. Methods used for assessing stresses in buccomaxillary prostheses: photoelasticity, finite element technique, and extensometry. J Craniofac Surg 2009; 20 (02) 561-564
- 14 Okeson JP. Management of Temporomandibular Disorders and Occlusion. 8th ed. St. Louis, MO:: Elsevier; 2019
- 15 Nishioka RS, Nishioka LN, Abreu CW, de Vasconcellos LG, Balducci I. Machined and plastic copings in three-element prostheses with different types of implant-abutment joints: a strain gauge comparative analysis. J Appl Oral Sci 2010; 18 (03) 225-230
- 16 Sotto-Maior BS, Senna PM, da Silva-Neto JP, de Arruda Nóbilo MA, Del Bel Cury AA. Influence of crown-to-implant ratio on stress around single short-wide implants: a photoelastic stress analysis. J Prosthodont 2015; 24 (01) 52-56