

Subscribe to RSS
DOI: 10.1055/s-0045-1813221
Role of Diffusion Tensor Imaging in Grading of Brain Tumors and Assessment of White Matter Tract Invasion
Authors

Abstract
Background
Diffusion tensor imaging (DTI) is a novel advancement of nuclear magnetic resonance that provides an accurate, noninvasive evaluation of brain tumors and their orientation to the adjacent white matter tract. We sought to analyze DTI's role in grading brain tumors and determining white matter tract involvement.
Materials and Methods
DTI with the “ep2d_diff_mddw_20_(DTI)” sequence was done in 48 individuals with brain tumors (22 low-grade and 26 high-grade). The DTI measurements, including fractional anisotropy (FA) and apparent diffusion coefficient (ADC), were checked in the tumor itself, the tumor margin, and the area around the tumor. After comparing the results between the two groups, the cutoff was determined using the receiver operating characteristic curve. Tensor maps were obtained by tractography to observe white matter tract involvement.
Results
Mean FA values in the intratumoral region and tumor margins were substantially lower in high-grade than low-grade tumors (p-value < 0.05). FA values greater than 0.12 intratumorally (sensitivity = 69.23% and specificity = 63.64%) and 0.26 at the tumor margin (sensitivity = 65.38% and specificity = 68.18%) can distinguish low-grade from high-grade brain tumors. The two groups' FA values for peritumoral edema and ADC values in different places did not significantly differ. Displacement of tracts was significantly associated with low-grade tumors, while high-grade tumors showed significantly more degrees of disruption, tract infiltration, and tract edema (p-value < 0.001).
Conclusion
DTI is a modern and effective method for predicting tumor aggressiveness and tract involvement in the tumor's surroundings before surgery.
Introduction
Brain tumors constitute less than 2% of all malignancies, yet their association with significant morbidity and death makes them the most feared. Meningioma is the most frequent histologically documented brain tumor, contributing to nearly a third of all central nervous system tumors (36%); after gliomas, it accounts for 28% of all primary cerebral tumors, with 80% of them being malignant.[1] Secondary brain tumors, also known as metastases, develop from either extracranial or intracranial primary neoplasms and are approximately 10 times more prevalent than primary brain tumors.[2] The World Health Organization (WHO) systemizes brain malignancies into I to IV classes depending on their aggressiveness, with grade IV tumors being the most aggressive and grade I tumors being generally nonaggressive.[1] The imaging data are useful in determining tumor grade in patients with brain tumors noninvasively and evaluating the patient's prognosis.[3]
Conventional magnetic resonance imaging (MRI) is a valuable modality in the primary assessment of brain tumors due to its multiplanar imaging capabilities, good anatomical delineation, and tumor characterization.[3] Diffusion tensor imaging (DTI) is a cutting-edge imaging technology that can show the specific location of a brain tumor and the orientation of its subcortical white matter tract (WMT) in vivo, as well as assess the tumor–tract relationship.[4] DTI detects water mobility in at least six noncollinear vectors, providing information about the pace and direction of H2O molecules in tissues.[5] The quantitative evaluation of water molecule diffusion is performed by measuring apparent diffusion coefficient (ADC) values. Anisotropy is the uneven spreading of molecules of water because H2O molecules can only move in certain directions.[6] Brain tumors result in severe disorganization in the WMT, resulting in different fractional anisotropy (FA) values. This idea applies to FA maps in brain tumors.[2] DTI quantifies the extent (diffusivity) and orientation (anisotropy) of H2O diffusion in WMT.[7]
DTI also allows for the identification of WMT involvement patterns surrounding the tumor. Tracts can be displaced, infiltrated, or disrupted, depending on the tumor's aggressiveness.[8] Because of the tumor's space-occupying impact, the WMT may become swollen and edematous even without infiltration.[9] DTI aids in the identification of functional areas in the tumor's superior, inferior, medial, and lateral aspects, allowing them to be preserved after surgery.[10] We sought to determine DTI's role in classifying brain tumors and assessing WMT involvement.
Materials and Methods
This observational study was conducted in the Department of Radiodiagnosis, Atal Bihari Vajpayee Institute of Medical Sciences and Dr. Ram Manohar Lohia Hospital, New Delhi, India, following obtaining ethical clearance from the ethics review board of the institute. Forty-eight patients with brain tumors for preprocedural MR were enrolled after obtaining informed consent, and individuals with general contraindications to MRI and postoperative cases of brain tumors were excluded.
MRI Protocol
All patients underwent MRI with a 3T MR scanner (Siemens Magnetom Skyra). “ep2d_diff_mddw_20_(DTI)” was the main sequence that was utilized to obtain DTI; it applied numerous diffusion gradients in 20 various angles, b = 0; b = 1000 seconds/mm2. The parameters used to perform the DTI were: voxel dimension = 1.7 × 1.7 × 4 mm; slice thickness = 4 mm (distance factor = 30); echo time (TE) = 92 ms; repetition time (TR) = 3700 ms. Both supratentorial and infratentorial regions were covered with 25 slices with no gaps. This sequence was acquired in 4 minutes and 39 seconds.
Images Analysis
Neuro 3D software was used to postprocess the DTI data. The DTI metrics (FA and ADC) were calculated manually by selecting regions of interest (ROIs) in three places inside and around the tumor: the intratumoral, the tumor margin, and the peritumoral region. It was important to avoid any areas with blood vessels, calcification, hemorrhage, cystic changes, or necrotic areas ([Fig. 1A]). Statistical analysis was conducted on the most representative FA and ADC data. Similarly, ROIs were manually made in an ipsilateral WMT and contralateral corresponding WMT. DTI data was postprocessed to produce color-coded WMT and identify their orientation to the lesion as well as the influence it had on these tracts.
The WMT was termed displaced when a mass effect with a changed orientation of the affected tract was observed next to the tumor, with normal tract FA values compared with FA values in the comparable contralateral tract.[8] Disruption of the WMT was indicated when FA values were observed to be significantly low and the fiber bundles that comprised the tracts seemed discontinuous or disrupted.[8] WMT was termed infiltrated if their FA values were lower than contralateral normal appearing white matter (NAWM), but the fiber bundles that formed these tracts remained intact. The changing hue of tracts on the color maps in locations with lower FA values suggests infiltration.[8] The WMT close to the tumor was termed edematous if it showed a hyperintensity on T2-weighted images, while FA values were found to be in the normal range in undamaged fibers.[9] The histopathological correlation was used in all patients to make the final tumor-type diagnosis. Data was put into an MS Excel spreadsheet, and statistical evaluation was performed with SPSS version 21.0 software. DTI-derived metrics were compared with the Mann–Whitney U test for two tumor groups. The receiver operating characteristic (ROC) curve was derived to assess the diagnostic effectiveness of the DTI metrics in distinguishing two tumor groups. Additionally, sensitivity and specificity values were obtained using ROC curves.
Results
Forty-eight individuals got a preoperative MRI assessment, with the maximum number of patients encountered in the 40 to 50 age group (mean age ∼38.6 years). Demographics and clinical properties of the research population are cited in [Table 1]. Brain tumors in our study population were classified using the 2016 WHO classification based on histological results. The low-grade tumor group included WHO grade I/II brain tumors, while the high-grade tumor group comprised grade III/IIV tumors. Twenty-two individuals had WHO grade III/IV (high-grade) tumors, while 26 had histological diagnoses indicating WHO grade I or II (low-grade) tumors ([Table 1]).
Abbreviations: SD, standard deviation; WHO, World Health Organization.
FA and ADC Values
In our study, high-grade tumors had mean FA values of 0.11 ± 0.08 in the intratumoral region, 0.24 ± 0.10 near the tumor edge, and 0.23 ± 0.14 in peritumoral edema ([Table 2]). Low-grade tumors showed mean FA values of 0.17 ± 0.08 in the intratumoral region, 0.32 ± 0.12 near the tumor edge, and 0.31 ± 0.21 in peritumoral edema. Our findings revealed that high-grade tumors had considerably lower FA values in the intratumoral region and tumoral margin than low-grade tumors (p < 0.05) ([Fig. 1] and [Table 2]).
Abbreviations: ADC, apparent diffusion coefficient; FA, fractional anisotropy; SD, standard deviation; WHO, World Health Organization.
Note: p-Value < 0.05 was considered statistically significant.
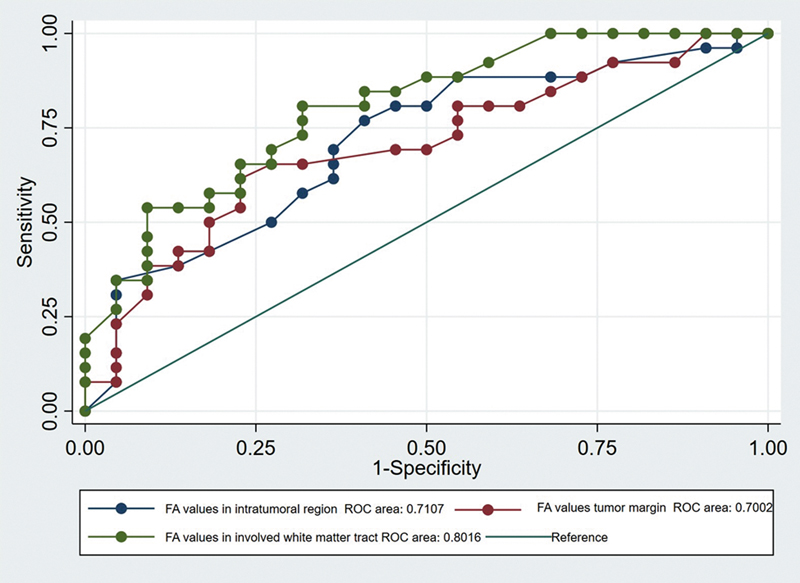
On ROC analysis, FA values greater than 0.12 in the intratumoral region and 0.26 at the tumor margin exhibited 69.23 and 65.38% sensitivity and 63.64 and 68.18% specificity in classifying tumors as low grade, respectively ([Table 3]).
Abbreviations: AUC, area under the curve; FA, fractional anisotropy.
In 22 patients of WHO grade III or IV tumors, the mean FA value in ipsilateral WMT adjacent to the tumor was 0.33 ([Table 4]). The average FA value in the contralateral comparable WMT was 0.57. The Mann–Whitney U test found a statistically significant correlation (p-value < 0.001) between low FA levels and WHO grade III and IV tumors ([Table 4]).
Abbreviations: FA, fractional anisotropy; SD, standard deviation; WHO, World Health Organization.
On ROC analysis, FA values less than 0.40 exhibited 73.08% sensitivity and 68.18% specificity in identifying brain tumors as high grade ([Table 3]). The area under the curves of FA values in the intratumoral region, at the tumor margin, and ipsilateral WMT were similar in differentiating the two tumor groups (p-value: 0.49; [Fig. 1]).
Low-grade tumors had mean ADC values of 1.48 ± 0.56 in the intratumoral region, 1.11 ± 0.32 near the tumor edge, and 1.10 ± 0.36 in peritumoral edema. High-grade tumors had mean ADC values of 1.32 ± 0.63 in the intratumoral region, 1.11 ± 0.30 near the tumor edge, and 1.26 ± 0.33 in peritumoral edema. The ADC readings were not substantially altered between the two tumor groups ([Table 2]).
Tractography in Brain Tumor
The patterns of WMT involvement in tractography differed in our study population. FA values were substantially low in ipsilateral WMT, close to grade III/IV brain tumors, indicating tract infiltration or disruption. Tract displacement in the white matter occurred in 35 individuals. Tract displacement adjacent to the tumor was observed in all 26 patients with histological diagnosis of WHO grade I/II tumors, as well as in 9 of the 22 patients (40.9%) with WHO grade III/IV brain tumors ([Fig. 2]).

Tract disruption was seen in 21 individuals in our study population. Nineteen out of 22 WHO grade III and IV brain tumors showed disruption of tracts traversing adjacent to the tumor ([Figs. 3] [4] [5]). Two out of 26 patients in WHO grades I and II also demonstrated WMT disruption.


Twenty patients had WMT infiltration adjacent to the tumor. Infiltration into the tract was observed in 18 of the 22 high-grade brain tumors. In addition to displacement, infiltration was seen in 2 of the 26 patients with WHO grade I/II tumors ([Fig. 5]).
WMT edema was found in 18 of the 48 patients. On histology, 15 of these 18 individuals were classified as low-grade tumors, while 3 were grouped as high-grade tumors. The displacement of WMT was significantly associated with low-grade tumors. The association was statistically significant (p-value < 0.001). Disruption, WMT infiltration, and edema were substantially linked with high-grade tumors (p-value < 0.001) ([Fig. 6]).

Discussion
Recent studies have revealed that DTI can provide precise preoperative delineation and a three-dimensional relationship between brain tumors and tracts. DTI improves the traditional diffusion MRI technique, which gives valuable information on tumor cellularity and microstructural tissue organization.[11] The ADC values in brain tumors reflect the diffusivity of water. They are influenced by tumor cellularity as well as the amount of extracellular and intracellular water. It is a nonspecific marker for differentiating between two tumor groups because it is altered in several diseases, such as acute infarction, abscess, and high-grade brain tumor.
Conversely, the FA values measure diffusion anisotropy and show how white matter is oriented, not just inside the WMTs. The altered FA value in brain tumors is due to tumor invasion into neurons and the direction of diffusion changing in brain tumors.[12] In the intratumoral region and at the tumor margins, the FA values were substantially lower in high-grade tumors (p-value < 0.05). In high-grade tumors, the FA values (0.11 ± 0.08) were very close to the mean FA values (0.173) found in 15 patients with high-grade gliomas, as reported by De Belder et al.[13] The drop in FA values is because there is more heterogeneity in high-grade tumors, which means that microscopic tracts lose their organization and integrity.[14] [15] Similarly, the FA values in the intratumoral region (0.11 ± 0.08) and at tumor margins (0.24 ± 0.10) in our study were similar to those shown by Goebell et al[16] on 12 patients with high-grade tumors. Their FA values were 0.16 ± 0.03 for the intratumoral region and 0.168 ± 0.066 for the tumor margin. Low FA values at the tumor margin in high-grade tumors are attributed to white matter infiltration.[15] [16]
The intratumorally mean FA values (0.17 ± 0.08) and the tumor margin mean FA values (0.32 ± 0.12) were in agreement with the findings of Goebell et al,[16] who discovered that the low-grade tumor group's median FA values were 0.14 ± 0.04 intratumorally and 0.25 ± 0.09 at the margin. Low-grade tumors had higher FA values due to a lower degree of microstructural disorganization and infiltration in the surrounding white matter. The low prediction accuracy (sensitivity and specificity ∼60–70%) of FA values intratumorally and at tumor margin in discriminating two groups is related to the complex pattern of white matter involvement and heterogeneous brain tumor population. There was no substantial variation in the ADC measurement intratumorally, at the tumor margin, in the peritumoral region, or the ipsilateral normal-appearing white matter in discriminating high-grade from low-grade brain tumors, likely due to our heterogeneous brain tumor study population.[7] [17]
Tractography revealed a differential pattern of WMT involvement with low-grade tumors, demonstrating significantly higher instances of displacement of adjacent WMT (p-value < 0.001). In contrast, high-grade tumors have a higher incidence of disruption, infiltration, and edema (p-value < 0.001). Low FA values in WMTs near tumors suggest tract infiltration or disruption.[18] [19] Previous investigations have found a considerable frequency of tract displacement in low-grade and disruption in high-grade malignancies (p-value < 0.05).[8] [20]
Despite this, there were certain limitations to the study. First, there was no unambiguous gold standard technique for validating tractography results and ensuring their dependability. Second, the brain tumor population, while broadly split into two tumor groups, was diverse, limiting the overgeneralization of DTI tensor metric data and tractography results to two tumor groups.
Conclusion
Our study found substantial variations in FA values in the intratumoral region, tumor margin, and tractography findings between two tumor groups. This adds to the growing evidence that DTI-derived tensor metric (FA) and tractography can be used to predict brain tumor grade and assess tract invasion. DTI metrics represent the histopathological aspects of brain tumors caused by differential cellularity and histology. They can be used before surgery to confirm the WMT's microstructural integrity and orientation, as well as to find out the aggressiveness of the brain tumor. This helps with preoperative triage to ensure minimal functional loss and neurological deficits after surgery.
Conflict of Interest
None declared.
Authors' Contributions
R.S. and S.M. contributed to the acquisition, analysis, conception, design, and drafting of the work. B.D.C. contributed to the final draft, revisions, upload, and submission of the final revised work. All authors have agreed to be personally accountable for their contributions and ensured that questions related to the accuracy or integrity of any part of the work, even those in which one was not personally involved, are appropriately investigated, resolved, and documented in the literature.
Ethical Approval
This work adhered to the principles outlined in the Declaration of Helsinki.
-
References
- 1 Ostrom QT, Gittleman H, Fulop J. et al. CBTRUS statistical report: primary brain and central nervous system tumors diagnosed in the United States in 2008–2012. Neuro-oncol 2015; 17 (Suppl 4, Suppl 4): iv1-iv62
- 2 Bulakbaşı N. Diffusion-tensor imaging in brain tumors. Imaging Med 2009; 1: 155-171
- 3 Costabile JD, Alaswad E, D'Souza S, Thompson JA, Ormond DR. Current applications of diffusion tensor imaging and tractography in intracranial tumor resection. Front Oncol 2019; 9: 426
- 4 Dubey A, Kataria R, Sinha VD. Role of diffusion tensor imaging in brain tumor surgery. Asian J Neurosurg 2018; 13 (02) 302-306
- 5 Hirsch D, Zussman B, Flanders A, Sharan A. Neurosurgical applications of magnetic resonance diffusion tensor imaging. JHN J 2012; 7
- 6 Jiang R, Du FZ, He C, Gu M, Ke ZW, Li JH. The value of diffusion tensor imaging in differentiating high-grade gliomas from brain metastases: a systematic review and meta-analysis. PLoS One 2014; 9 (11) e112550
- 7 Piyapittayanan S, Chawalparit O, Tritakarn SO. et al. Value of diffusion tensor imaging in differentiating high-grade from low-grade gliomas. J Med Assoc Thai 2013; 96 (06) 716-721
- 8 Itagiba VGA, Borges R, da Cruz Jr LCH, Furtado AD, Domingues RC, Gasparetto EL. Use of diffusion tensor magnetic resonance imaging in the assessment of patterns of white matter involvement in patients with brain tumors: is it useful in the differential diagnosis?. Radiol Bras 2010; 43: 362-368
- 9 Yen PS, Teo BT, Chiu CH, Chen SC, Chiu TL, Su CF. White Matter tract involvement in brain tumors: a diffusion tensor imaging analysis. Surg Neurol 2009; 72 (05) 464-469 , discussion 469
- 10 Farshidfar Z, Faeghi F, Mohseni M, Seddighi A, Kharrazi HH, Abdolmohammadi J. Diffusion tensor tractography in the presurgical assessment of cerebral gliomas. Neuroradiol J 2014; 27 (01) 75-84
- 11 Stieltjes B, Schlüter M, Didinger B. et al. Diffusion tensor imaging in primary brain tumors: reproducible quantitative analysis of corpus callosum infiltration and contralateral involvement using a probabilistic mixture model. Neuroimage 2006; 31 (02) 531-542
- 12 Lee HY, Na DG, Song IC. et al. Diffusion-tensor imaging for glioma grading at 3-T magnetic resonance imaging: analysis of fractional anisotropy and mean diffusivity. J Comput Assist Tomogr 2008; 32 (02) 298-303
- 13 De Belder FE, Oot AR, Van Hecke W. et al. Diffusion tensor imaging provides an insight into the microstructure of meningiomas, high-grade gliomas, and peritumoral edema. J Comput Assist Tomogr 2012; 36 (05) 577-582
- 14 Papageorgiou TS, Chourmouzi D, Drevelengas A, Kouskouras K, Siountas A. Diffusion tensor imaging in brain tumors: a study on gliomas and metastases. Phys Med 2015; 31 (07) 767-773
- 15 Tropine A, Vucurevic G, Delani P. et al. Contribution of diffusion tensor imaging to delineation of gliomas and glioblastomas. J Magn Reson Imaging 2004; 20 (06) 905-912
- 16 Goebell E, Paustenbach S, Vaeterlein O. et al. Low-grade and anaplastic gliomas: differences in architecture evaluated with diffusion-tensor MR imaging. Radiology 2006; 239 (01) 217-222
- 17 El-Serougy L, Abdel Razek AAK, Ezzat A, Eldawoody H, El-Morsy A. Assessment of diffusion tensor imaging metrics in differentiating low-grade from high-grade gliomas. Neuroradiol J 2016; 29 (05) 400-407
- 18 Morita N, Wang S, Kadakia P, Chawla S, Poptani H, Melhem ER. Diffusion tensor imaging of the corticospinal tract in patients with brain neoplasms. Magn Reson Med Sci 2011; 10 (04) 239-243
- 19 Price SJ, Burnet NG, Donovan T. et al. Diffusion tensor imaging of brain tumours at 3T: a potential tool for assessing white matter tract invasion?. Clin Radiol 2003; 58 (06) 455-462
- 20 Shalan ME, Soliman AY, Nassar IA, Alarabawy RA. Surgical planning in patients with brain glioma using diffusion tensor MR imaging and tractography. Egypt J Radiol Nucl Med 2021; 52: 110
Address for correspondence
Publication History
Article published online:
12 November 2025
© 2025. Asian Congress of Neurological Surgeons. This is an open access article published by Thieme under the terms of the Creative Commons Attribution-NonDerivative-NonCommercial License, permitting copying and reproduction so long as the original work is given appropriate credit. Contents may not be used for commercial purposes, or adapted, remixed, transformed or built upon. (https://creativecommons.org/licenses/by-nc-nd/4.0/)
Thieme Medical and Scientific Publishers Pvt. Ltd.
A-12, 2nd Floor, Sector 2, Noida-201301 UP, India
-
References
- 1 Ostrom QT, Gittleman H, Fulop J. et al. CBTRUS statistical report: primary brain and central nervous system tumors diagnosed in the United States in 2008–2012. Neuro-oncol 2015; 17 (Suppl 4, Suppl 4): iv1-iv62
- 2 Bulakbaşı N. Diffusion-tensor imaging in brain tumors. Imaging Med 2009; 1: 155-171
- 3 Costabile JD, Alaswad E, D'Souza S, Thompson JA, Ormond DR. Current applications of diffusion tensor imaging and tractography in intracranial tumor resection. Front Oncol 2019; 9: 426
- 4 Dubey A, Kataria R, Sinha VD. Role of diffusion tensor imaging in brain tumor surgery. Asian J Neurosurg 2018; 13 (02) 302-306
- 5 Hirsch D, Zussman B, Flanders A, Sharan A. Neurosurgical applications of magnetic resonance diffusion tensor imaging. JHN J 2012; 7
- 6 Jiang R, Du FZ, He C, Gu M, Ke ZW, Li JH. The value of diffusion tensor imaging in differentiating high-grade gliomas from brain metastases: a systematic review and meta-analysis. PLoS One 2014; 9 (11) e112550
- 7 Piyapittayanan S, Chawalparit O, Tritakarn SO. et al. Value of diffusion tensor imaging in differentiating high-grade from low-grade gliomas. J Med Assoc Thai 2013; 96 (06) 716-721
- 8 Itagiba VGA, Borges R, da Cruz Jr LCH, Furtado AD, Domingues RC, Gasparetto EL. Use of diffusion tensor magnetic resonance imaging in the assessment of patterns of white matter involvement in patients with brain tumors: is it useful in the differential diagnosis?. Radiol Bras 2010; 43: 362-368
- 9 Yen PS, Teo BT, Chiu CH, Chen SC, Chiu TL, Su CF. White Matter tract involvement in brain tumors: a diffusion tensor imaging analysis. Surg Neurol 2009; 72 (05) 464-469 , discussion 469
- 10 Farshidfar Z, Faeghi F, Mohseni M, Seddighi A, Kharrazi HH, Abdolmohammadi J. Diffusion tensor tractography in the presurgical assessment of cerebral gliomas. Neuroradiol J 2014; 27 (01) 75-84
- 11 Stieltjes B, Schlüter M, Didinger B. et al. Diffusion tensor imaging in primary brain tumors: reproducible quantitative analysis of corpus callosum infiltration and contralateral involvement using a probabilistic mixture model. Neuroimage 2006; 31 (02) 531-542
- 12 Lee HY, Na DG, Song IC. et al. Diffusion-tensor imaging for glioma grading at 3-T magnetic resonance imaging: analysis of fractional anisotropy and mean diffusivity. J Comput Assist Tomogr 2008; 32 (02) 298-303
- 13 De Belder FE, Oot AR, Van Hecke W. et al. Diffusion tensor imaging provides an insight into the microstructure of meningiomas, high-grade gliomas, and peritumoral edema. J Comput Assist Tomogr 2012; 36 (05) 577-582
- 14 Papageorgiou TS, Chourmouzi D, Drevelengas A, Kouskouras K, Siountas A. Diffusion tensor imaging in brain tumors: a study on gliomas and metastases. Phys Med 2015; 31 (07) 767-773
- 15 Tropine A, Vucurevic G, Delani P. et al. Contribution of diffusion tensor imaging to delineation of gliomas and glioblastomas. J Magn Reson Imaging 2004; 20 (06) 905-912
- 16 Goebell E, Paustenbach S, Vaeterlein O. et al. Low-grade and anaplastic gliomas: differences in architecture evaluated with diffusion-tensor MR imaging. Radiology 2006; 239 (01) 217-222
- 17 El-Serougy L, Abdel Razek AAK, Ezzat A, Eldawoody H, El-Morsy A. Assessment of diffusion tensor imaging metrics in differentiating low-grade from high-grade gliomas. Neuroradiol J 2016; 29 (05) 400-407
- 18 Morita N, Wang S, Kadakia P, Chawla S, Poptani H, Melhem ER. Diffusion tensor imaging of the corticospinal tract in patients with brain neoplasms. Magn Reson Med Sci 2011; 10 (04) 239-243
- 19 Price SJ, Burnet NG, Donovan T. et al. Diffusion tensor imaging of brain tumours at 3T: a potential tool for assessing white matter tract invasion?. Clin Radiol 2003; 58 (06) 455-462
- 20 Shalan ME, Soliman AY, Nassar IA, Alarabawy RA. Surgical planning in patients with brain glioma using diffusion tensor MR imaging and tractography. Egypt J Radiol Nucl Med 2021; 52: 110