

Subscribe to RSS
DOI: 10.1055/s-0045-1813745
Radiological Insights into Alcohol Use Associated Disorders and Diseases: Part I
Authors
Funding Sudhakar K. Venkatesh receives Textbook royalties from Springer-Verlag. All the other authors declare no financial disclosure associated with contents of this manuscript.


Abstract
Alcohol use disorder (AUD) is a significant public health challenge, affecting multiple organs and organ systems, and fetal health. Additionally, AUD also significantly contributes to self-harm and road accidents. Beyond its health effects, AUD creates economic and political challenges, including escalating treatment costs and the complex alcohol regulation policies. Despite global impact, AUD remains under-addressed in countries like India due to cultural norms and limited resources. Early recognition of AUD is vital for better outcomes, relying on thorough clinical evaluation and patient history. However, denial, inebriation, or lack of awareness often delays diagnosis. Imaging techniques like ultrasound, CT, and MRI effectively depict AUD-related organ damage and aid in detecting chronic alcohol use. Radiologists play a crucial role in identifying these manifestations, contributing to its early detection and treatment. This review article highlights the imaging of alcohol use related disorders and diseases affecting different organs and organ systems at various stages. The review is presented in two parts: the first focuses on alcohol burden, alcohol metabolism and toxicity, and imaging findings of AUD-related abdominal diseases and disorders.
Keywords
alcoholic liver disease - alcoholic hepatitis - alcoholic cirrhosis - fatty liver - alcoholic pancreatitis - alcoholic gastritisIntroduction
Alcohol, or ethyl alcohol (ethanol), is a toxic psychoactive substance consumed for its transient euphoric effects. Although moderate use is accepted in many cultures, its temporary elating effects can lead to alcohol use disorder (AUD), characterized by dependence and loss of control. AUD poses significant health risks, damaging regulatory functions and organ tissues, leading to a broad spectrum of mental and behavioral disorders, liver diseases, cardiovascular disorders, and cancers. Alcohol has been implicated as a causal factor in more than 200 diseases and injury conditions by the World Health Organization (WHO).[1] The harmful effects of alcohol are associated with heavy drinking, binge drinking, underage drinking, and drinking during pregnancy ([Box 1]). The severity of organ damage is more closely related to the duration, amount, and frequency of alcohol consumption rather than the type of alcoholic beverage consumed.[1] [2] [3]
Sources: SAMHSA. Appendix A: key definitions for the 2023 National Survey on Drug Use and Health. Accessed December 25, 2024 at: https://www.samhsa.gov/data/report/2023-nsduh-detailed-tables.
NIAAA, Alcohol's Effect on Health. Glossary. Updated November 2024. Accessed December 25, 2024 at: https://www.niaaa.nih.gov/alcohols-effects-health/alcohol-topics-z/alcohol-facts-and-statistics/glossary.
Dietary Guidelines for Americans: 2020–2025. Accessed November 21, 2025 at: https://www.dietaryguidelines.gov/resources/2020-2025-dietary-guidelines-online-materials.
In 2019, alcohol accounted for 2.6 million deaths (4.7% of all deaths),[1] with a higher number of deaths is in males (2 million) and the highest impact on persons aged 20 to 39 years, contributing to 6.9% disability-adjusted life years (DALYs). Despite some regions reporting declining AUD prevalence, increases have been observed in Africa, Eastern Mediterranean, and South-East Asia.[1] The COVID-19 pandemic has worsened AUD's global impact due to increased alcohol consumption. Developing effective alcohol policies remain challenging due to industry interference and resource limitations, especially in lower GDP countries.
India, the world's third largest alcohol market, faces significant AUD burden.[4] Alcohol consumption volumes rose from 7,500 million liters to 12,400 million liters in 2019, with projections reaching 13,822 million liters by 2023.[4] The alcohol use problem in India is summarized in [Box 2]. Addressing AUD, including prohibition efforts, is difficult due to high relapse rates and treatment dropout.[5] Alcohol use in India is deeply tied to several factors including socio-cultural practices, varied regional (state) policies, inconsistent regulation, and low awareness that complicate the issue further, highlighting the urgent need for comprehensive strategies.[6]
Abbreviations: AUD, alcohol use disorder; GDP, gross domestic product.
Source: NAMS task force report on Alcohol, substance use disorders, and behavioral addictions in India. Annals of the National Academy of Medical Sciences (India) 2024. DOI: 10.25259/ANAMS_TFR_04_2024
Early diagnosis and timely intervention are crucial for successful treatment of alcohol-associated disorders. However, self-reporting is often unreliable due to social stigma, memory issues, and lack of awareness, leading to potential misdiagnoses and suboptimal treatment. Although imaging cannot directly diagnose AUD, it helps detect complications such as alcohol-related liver disease and brain abnormalities. These imaging findings can support clinical suspicion and enhance diagnostic accuracy when combined with other methods.
For radiologists, understanding the imaging features of AUD is essential for early detection and intervention, improving patient outcomes. Radiologists can alert treating providers to the non-invasive detection of alcohol's deleterious effects. This review highlights the radiological manifestations of common alcohol-associated disorders across various organ systems, emphasizing the critical role of imaging in addressing this public health challenge. The review is in two parts: the first part covers the metabolism, toxicity of alcohol, and gastrointestinal manifestations with a focus on alcohol liver disease; the second part covers the other organ systems affected by AUD.
Alcohol Metabolism and Toxicity
Upon ingestion, alcohol is absorbed from the small intestine and reaches peak blood alcohol concentration (BAC) within 10 to 60 minutes. The BAC levels depend on lean body weight, gender, food consumption, alcohol concentration, smoking cigarettes, gastric bypass surgery, and drugs affecting the pyloric sphincter or gastric emptying.[7] Being hygroscopic, alcohol crosses biological membranes by passive diffusion, quickly distributes into total body water, and is eliminated via zero-order kinetics.
Nearly all ingested alcohol (92–98%) is metabolized in liver, and approximately 2 to 8% is excreted unchanged in breath, urine, and sweat.[7] Alcohol metabolism involves oxidative and non-oxidative pathways. The oxidative pathway adds oxygen or removes hydrogen via alcohol dehydrogenase (ADH), cytochrome p450 (CYP2E1), and catalase enzymes, reducing in this process nicotinamide adenine dinucleotide (NAD+) to form NADH. Metabolism via CYP2E1 also produces reactive oxygen species (ROS), superoxide anions, and hydroxy radicals. Acetaldehyde, alcohol's main metabolite, is toxic and responsible for many harmful effects and further metabolized by aldehyde dehydrogenase (ALDH) into less toxic acetate. Acetaldehyde can bind to proteins impairing protein secretion forming carcinogenic DNA adducts increasing carcinoma risk along with ROS.[8]
A trace amount of alcohol (0.1–0.2%) undergoes non-oxidative metabolism to produce conjugates like ethyl glucuronide (EtG), ethylsulfate (EtS), various fatty acid ethyl esters (FAEE), and phosphatidylethanol (PEth).[9] [10] These are slowly eliminated from body and detectable in blood and urine for longer periods than alcohol, serving as clinical biomarkers of alcohol consumption, and heavy drinking. Alcohol metabolism varies widely among individuals, depending on factors like chronicity of alcohol consumption, diet, age, smoking, and genetics.
Alcohol and Gastrointestinal Disorders
Oropharynx
The oral mucosa, pharynx, esophagus, and gastrointestinal mucosa come into contact with alcohol immediately after ingestion. High concentration alcoholic drinks can cause dehydration, mucosal irritation, and inflammation. Chronic drinking may result in damage to salivary glands and can cause parotid gland hypertrophy ([Fig. 1]). The exact cause for this hypertrophy is unclear but is linked to poor oral hygiene and associated with alcohol-induced tooth decay, periodontal disease, and tooth loss.[11] [12] Chronic alcohol use is associated with increased risk of oropharyngeal ([Fig. 1]) and laryngeal cancers and the risk increases with concurrent use of tobacco.

Esophagus
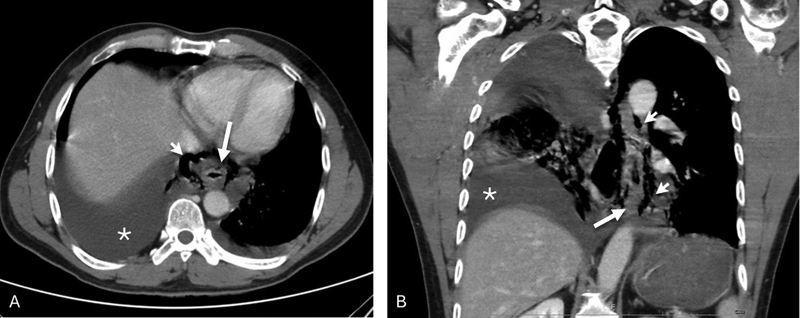
Excessive alcohol intake impairs esophageal motility and weakens the lower esophageal sphincter, leading to gastroesophageal reflux disease (GERD) and esophagitis.[13] GERD may be associated with Barrett's esophagus which can cause esophageal strictures and increase esophageal cancer risk. Repeated retching and vomiting associated with heavy drinking can cause mucosal tears (Mallory-Weiss syndrome) or esophagus rupture (Boerhaave syndrome), a rare but life-threatening condition presenting with vomiting, pain, hematemesis, subcutaneous emphysema, and sometimes life-threating pneumothorax or pleural effusion.[11] Chest X-rays may reveal mediastinal widening, pneumomediastinum, pneumothorax, or pleural effusion, while esophagrams and CT scans provide more details and associated complications ([Fig. 2]). Boerhaave syndrome is diagnosed by exclusion of other causes like previous esophageal surgery and bulimia. AUD is also associated with higher esophageal cancer risk ([Fig. 3]), especially in smokers.

Stomach
Alcohol's contact with stomach mucosa until it empties into the small intestine can cause mucosal irritation and erosions. In the stomach and duodenum, this leads to gastritis and hemorrhagic lesions. Imaging of acute gastritis may demonstrate gastric wall thickening ([Fig. 4]), which can improve with abstinence of alcohol. Alcohol can also interfere with stomach motility, reducing gastric motility and delaying stomach emptying.[11]

Small Intestine
Chronic alcohol use can cause duodenal erosions and bleeding. Alcohol diffuses through and damages cell membranes and disrupts tight intercellular adhesions, which leads to leaky intestinal epithelium. This allows translocation of bowel contents, including bacteria and bacterial antigens like lipopolysaccharides (LPS), to enter the systemic circulation, initiating an inflammatory response with release of cytokines such as IL-6 and causing systemic inflammation. This disrupts gut microbiota, leading to gut dysbiosis and impairing nutrient absorption, causing vitamin and mineral deficiencies.[14] [15] Chronic alcohol misuse and socioeconomic factors like poverty exacerbate malnutrition.
A small amount of alcohol is produced by luminal bacteria by breaking down carbohydrates. In cases of reduced gastric emptying with accompanying bacterial overgrowth, more alcohol is produced. In rare cases, autobrewery syndrome (ABS), also known as gut fermentation syndrome, occurs due to overgrowth of fermenting yeasts such as Candida and Saccharomyces, along with other intestinal bacteria. This overgrowth increases the breakdown of carbohydrates into alcohol, which is then absorbed, leading to signs of alcohol intoxication.[16] The confirmatory test is elevated blood or breath alcohol levels after a glucose challenge test.[17] CT or MR enterography helps to rule out bowel pathologies causing stasis. Managing ABS involves avoiding high-carbohydrate diets and using antibiotics. Increasing awareness of ABS is crucial to prevent legal complications.
Colon
Gut dysbiosis and increased permeability of colonic mucosa by alcohol may lead to colonic inflammation. The increased concentration of acetaldehyde in the lumen from alcohol metabolism by intestinal mucosa and bacteria contributes to alcohol-induced diarrhea and potentially increased risk of colonic cancer.[18]
Alcoholic Liver Disease
As the principal organ for metabolizing alcohol, the liver is highly vulnerable to alcohol-induced damage. Alcohol metabolism leads to hypoxia, formation of ROS, and changes in the NADH/NAD ratio, with hypoxia most pronounced in perivenular (central vein) hepatocytes. Acetaldehyde binds to lipids, proteins, and DNA forming immunogenic adducts that can cause hepatocellular damage and inflammation.[19] [20] Mitochondrial alterations lead to functional impairments, including decreased ATP generation, ROS production, and reduced acetaldehyde dehydrogenase activity. Acetaldehyde stimulates collagen I synthesis in hepatic stellate cells (HSCs), and release of inflammatory cytokines and chemokines.[21] Endotoxemia from increased gut permeability interacts with Kupffer cells, activating a proinflammatory cascade and contributing to further hepatocellular damage.[22]
Alcohol-associated liver disease (ALD) is the leading cause of alcohol-related deaths, responsible for 4% of all deaths worldwide, mostly due to cirrhosis and liver cancer.[22] [23] The spectrum of ALD includes steatosis, steatohepatitis, progressive fibrosis, alcohol-associated hepatitis (AH), cirrhosis, and hepatocellular carcinoma.[24] Hepatic steatosis occurs in 90% of excessive drinkers and can develop within 2 weeks of heavy drinking, but it often resolves rapidly with abstinence.[25] [26] Among those with ALD, one-third develop steatohepatitis, 20 to 40% progress to fibrosis, and 8 to 20% develop cirrhosis, with inflammation significantly increasing cirrhosis risk.[25] Diagnosing ALD requires evidence of chronic AUD and exclusion of other chronic liver diseases.[27] Serum liver enzyme levels are not more than five times the upper limit of normal, and an AST-to-ALT ratio greater than 1.5 is very suggestive of ALD.
The prevalence of ALD globally has been increasing since 2014 and the COVID-19 pandemic resulted in higher mortality and ALD-related liver transplant listings.[27] [28] The prevalence of ALD and alcoholic cirrhosis increased from 2.6% and 0.3%, respectively in the general population to 51% and 12.9% in patients with AUD.[29] ALD is now the leading indication for liver transplantation in the United States.[30]
Early detection of ALD is critical for management and prognosis but challenging as most patients are asymptomatic and often remain undetected until advanced stages. Leading international societies, including the American College of Gastroenterology (ACG), the American Association for the Study of Liver Diseases (AASLD), the European Association for the Study of Liver (EASL), and the Spanish Association for the Study of Liver (AEEH), have recommended using ultrasound, CT, and MRI in ALD for detection of steatosis, fibrosis assessment, and exclusion of other chronic liver diseases.[25] [31] [32] [33] Furthermore, the Chinese Association for the Study of Liver Diseases (CASLD) guidelines incorporate imaging as a criterion for diagnosis and severity classification of ALD, and the AEEH recommends the use of elastography to identify advanced fibrosis.[33] [34]
Hepatic steatosis is the earliest and most common manifestation of ALD, developing due to decreased fatty acid oxidation, increased fatty acid and triglyceride synthesis due to redox state of liver from alcohol metabolism, increased mobilization of fatty acids from peripheral adipose deposits, and increased supply by small intestine.[35] Liver biopsy is rarely needed and non-invasive imaging is sufficient for diagnosing fatty liver.[36] Both hepatic steatosis and steatohepatitis appear as fatty liver on conventional imaging (ultrasound, CT, and MRI) and are difficult to differentiate without additional parameters or non-invasive tests. The following paragraphs outline ALD imaging features on ultrasound, CT, and MRI, and differentiation of ALD from metabolic dysfunction associated steatotic liver disease (MASLD), formerly termed non-alcoholic fatty liver disease (NAFLD).
Ultrasound and Ultrasound Elastography
On ultrasound, fatty liver is identified by diffuse parenchymal hyperechogenicity exceeding that of the renal cortex or spleen, blurring of vessel walls, and distal beam attenuation ([Fig. 5]).[37] However, ultrasound interpretation is variable,[38] with sensitivity of 60 to 94% and a specificity of 88 to 95% for detection of hepatic steatosis, with higher accuracy for steatosis of over 30%.[39] Qualitative features for differentiating steatosis grades ([Table 1]) have significant interobserver variability, affecting reproducibility and small changes evaluation.[39] Hepatorenal index and quantitative ultrasound parameters such as attenuation, backscatter coefficient, and speed of sound may assist in fat quantification.[40] Controlled attenuation parameter has good accuracy (0.77–0.82) for differentiating mild, moderate, and severe steatosis.[41] Gray-scale ultrasound cannot differentiate simple steatosis from steatohepatitis. With liver fibrosis, ultrasound may show coarse parenchymal echoes, similar to fatty liver, and confound each other. Subtle surface nodularity, indicating fibrosis, may require elastography for confirmation of fibrosis if other features are absent ([Fig. 6]). As fibrosis progresses, surface nodularity becomes more evident especially with the use of high-resolution ultrasound ([Fig. 7]). Cirrhosis is characterized by surface nodularity, blunted liver edges and contours, segmental/lobar hypertrophy, or atrophy ([Fig. 8]), and features of portal hypertension.

|
Modality |
Grading |
Comments |
|---|---|---|
|
US |
• Mild—increased echogenicity to adjacent normal right kidney • Moderate—increased echogenicity, blurred vessel walls, and poor visualization of diaphragm • Severe—poor visualization of vessels and diaphragm |
• Subjective • Poor reproducibility • Confounds with liver fibrosis and infiltrative diseases • Coexistent renal disease may affect renal echogenicity |
|
CT |
• Non-contrast CT for moderate steatosis o Liver attenuation <40 HU o Liver attenuation <10 HU than spleen o Liver to spleen attenuation ratio <0.8 • Contrast-enhanced CT for moderate steatosis o Liver attenuation <80 HU |
• Ionizing radiation • Low sensitivity for mild steatosis • CT techniques are variable including the energy of X-rays used • Metal deposition in liver may affect attenuation • Contrast injection rate and timing of acquisition may affect enhancement |
|
MRI |
• Fat signal fraction using in- and out-of-phase T1-weighted images (>5%) • Proton density fat fraction (PDFF)[a] o <6% normal o 6–17% mild o 17–22% moderate o >22%—severe |
• Affected by MR sequence parameters and modifications made by vendors • Coexisting iron overload may reduce sensitivity • Susceptible to artifacts • PDFF currently not widely available |
Note: aGrade refers to histologic grading.


Elastography is useful for quantifying liver stiffness and staging liver fibrosis ([Table 2]). Ultrasound based elastography methods include vibration controlled transient elastography (VCTE, Fibroscan), point shear wave elastography (pSWE), and two-dimensional shear wave elastography (2D SWE). Both VCTE and SWE are bedside-compatible, suitable for longitudinal monitoring, and effective for population screening, with similar accuracy (>0.95) in detecting advanced fibrosis and cirrhosis (>0.95).[42] Elevated liver stiffness measurement (LSM) should be carefully interpreted considering patient factors (alcohol abstinence, post-prandial status, obesity, and steatosis) and technical factors (probe and operator variability).[32] [43] In AH, liver stiffness can be significantly elevated due to inflammation, requiring careful interpretation to avoid misclassification as cirrhosis or decompensated ACLD ([Fig. 9]).
|
Modality |
Liver stiffness measurement (LSM) |
Comments |
|---|---|---|
|
VCTE |
<6 kPa: normal >6 kPa: liver fibrosis >12.5 kPa: cirrhosis |
• Operator error • Blind technique • Limited depth of penetration • Additional confounders: fatty liver and obesity |
|
SWE |
<5 kPa: high probability of normal <9 kPa: rules out compensated advanced chronic liver disease (cACLD) 9–13 kPa: suggests cACLD but needs further confirmation >13 kPa: rules in cACLD >17 kPa: suggests clinically significant portal hypertension (CSPH) |
• Operator error • Obesity • Additional confounders: fatty liver and obesity |
|
MRE |
<2.5 kPa: normal 2.5 to <3.0 kPa: normal or inflammation 3.0 to <3.5 kPa: stage 1–2 fibrosis 3.5 to <4.0 kPa: stage 2–3 fibrosis 4.0 to 5.0 kPa: stage 3–4 fibrosis >5.0 kPa: stage 4 fibrosis or cirrhosis |
• Not widely available • Technical failure in moderate to severe iron deposition • Not affected by fatty liver |
Abbreviations: MRE, magnetic resonance elastography; SWE, shear wave elastography; VCTE, vibration controlled transient elastography (Fibroscan).
Note: aAll elastography techniques are confounded by post-prandial state, recent or continued use of alcohol, acute inflammation, acute biliary obstruction, hepatic congestion, and other infiltrative disorders of liver.

Computed Tomography (CT)
On non-contrast enhanced CT, fatty liver shows parenchyma hypoattenuation, often less than the spleen ([Fig. 10]). Moderate hepatic steatosis can be diagnosed when liver attenuation is <40 Hounsfield units (HU), or at least 10 HU less than spleen, or the liver-to-spleen attenuation ratio is less than 0.8.[44] [45] However, on contrast-enhanced CT, diagnosing fatty liver based on attenuation is less reliable. An attenuation value <80 HU during portal venous phase has a sensitivity of 78 to 86% and specificity of 90 to 93% for moderate hepatic steatosis.[46] Steatohepatitis may present as hepatomegaly and heterogeneous parenchyma enhancement, though these findings are not specific. With liver fibrosis, CT may show heterogeneous parenchymal texture ([Fig. 11]), heterogeneous enhancement, surface nodularity, and regenerative nodules. Textural changes can also appear in hepatic steatosis when heterogeneous enhancement, particularly in nodular steatosis, is non-specific. Cirrhosis manifests as volume changes in lobes/segments and may include features of portal hypertension, such as splenomegaly, esophageal varices, and ascites ([Fig. 12]). Morphological features associated with cirrhosis include increased caudate-to-right lobe (CRL) ratio >0.9 (modified CRL >0.65), increased periportal space, widened gall bladder fossa, widened posterior hepatic notch etc.[47] However, these morphological features are specific and useful only when present and do not rule out cirrhosis in their absence, particularly in enlarged and fatty liver.


Magnetic Resonance Imaging (MRI) and MR Elastography (MRE)
MRI, using fat suppression sequences and chemical-shift imaging (CSI)-based in- and out-of-phase imaging, easily detects hepatic steatosis ([Fig. 13]). The Dixon-based multi-echo technique accurately quantifies hepatic steatosis, providing the proton density fat fraction (PDFF). A PDFF >5 to 6% indicates hepatic steatosis.[26] [48] Although grading of hepatic steatosis with PDFF into mild, moderate, and severe[48] [49] is still under evaluation, its accuracy is excellent, documenting small changes and demonstrating heterogeneous distribution of hepatic steatosis.

Sometimes the hepatic steatosis manifests as nodular deposits or, rarely, as tram track–like hypoattenuation along the vessels ([Fig. 14]). The exact mechanism of this peculiar distribution of fat is not known.[50] [51] MRI also detects increased liver iron, common in advanced ALD due to reduced hepcidin production which inhibits duodenal absorption of iron from diet. Liver iron concentration (LIC) may be quantified using R2 or R2* maps. Rarely iron deposition along the vessels may be seen in alcoholic cirrhosis ([Fig. 15]).[52] [53] Recognizing this appearance prevents unnecessary biopsies.

Alcoholic steatohepatitis may manifest as heterogeneous signal intensity on T2-weighted or diffusion-weighted MRI, and heterogeneous parenchymal enhancement on dynamic contrast-enhanced CT/MRI but distinguishing it from simple steatosis can be challenging.[24] MR elastography (MRE) helps in assessing liver stiffness ([Fig. 16]), which may indicate steatohepatitis or fibrosis.

Surface nodularity, a rounded or lobulated outline, and heterogeneous parenchyma suggest fibrosis. T2-weighted and diffusion-weighted MRI may show parenchymal signal heterogeneity, while post-contrast T1-weighted sequences may reveal heterogeneous enhancement. Subtle textural changes without clear morphological signs can also indicate fibrosis, which MRE can confirm ([Fig. 17]). Differentiating early from advanced fibrosis relies heavily on elastography rather than imaging morphology alone.[24] [48] Advanced fibrosis is characterized by nodularity, lobulated contour, right lobe atrophy, and caudate or left lobe hypertrophy, often with signs of portal hypertension.[54] [55]

MRE is precise for non-invasive liver stiffness measurement, distinguishing early fibrosis stages, unaffected by steatosis or obesity, and reliable for longitudinal changes. However, it has technical limitations in patients with severe iron overload.[48] [56] [57] The advantages of MRE include accurate fibrosis staging, consistency across MR scanners, and longitudinal reliability.[57] Disadvantages include accessibility issues, longer scan times, higher cost, and incompatibility with claustrophobic patients.
MRI findings in ALD are similar to those in MASLD (NAFLD). In patients with significant alcohol intake (arbitrary threshold of 210 g/wk for men and 140 g/wk for women) and MASLD, it is termed MetALD.[58] Alcohol consumption increases fibrosis risk in MASLD patients.[59] Accurate alcohol intake history is crucial for distinguishing MASLD from ALD. Differences and similarities between ALD and MASLD are detailed in [Table 3].
|
Feature |
ALD |
MASLD |
Comments |
|---|---|---|---|
|
Alcohol use |
Most important feature for diagnosis |
No/low/moderate use of alcohol and below MetALD cut-off |
Self-report of alcohol use is not reliable |
|
Presentation |
Most commonly asymptomatic except for alcoholic hepatitis (AH) |
Most commonly asymptomatic |
Acute presentation not a feature of MASLD |
|
Tests for alcohol use[a] |
Positive |
Positive or negative |
|
|
AST/ALT ratio |
>1.5 |
<1.5 |
|
|
GGT |
Elevated |
Normal |
|
|
ANI |
<0 |
>0 |
|
|
Imaging |
|||
|
Hepatic steatosis |
Often heterogeneous |
May be homogeneous |
Severity of steatosis does not differentiate |
|
Morphology |
Dysmorphic liver especially in AH |
Hepatomegaly |
|
|
Post contrast enhancement |
Heterogeneous in AH |
Usually, homogeneous |
|
|
Histology |
Hepatocyte ballooning, neutrophilic inflammation, and cholestasis more prominent |
Hepatic steatosis most prominent |
Abbreviations: ALD, alcohol-associated liver disease; ALT, alanine aminotransferase; ANI, ALD/NAFLD index (calculated from patients' sex, BMI, AST/ALT ratio, and mean corpuscular volume); AST, aspartate aminotransferase; GGT, gamma glutamyl transferase; MASLD, metabolic dysfunction associated steatotic liver disease.
Note: aSerum tests for alcohol includes tests for ethyl glucuronide, ethyl sulfate, and phosphatidyl esters.
ALD Complications
As outlined above, cirrhosis, portal hypertension, and hepatic decompensation are the most common complications from ALD. Hepatocellular carcinoma (HCC) can arise in ALD patients particularly in cirrhotic livers. HCCs typically demonstrate arterial phase hyperenhancement, washout in portal venous and/or delayed phase, and may show presence of a capsule ([Fig. 18]). The diagnosis is largely dependent on CT/MRI Liver Imaging Reporting and Data System (LI-RADS) criteria and contrast-enhanced US criteria.[60] In steatotic livers, often without any morphological changes of cirrhosis, washout of HCC may not be well demonstrated due to hypodense or hypointense steatotic liver parenchyma,[61] making diagnosis of HCC with LI-RADS criteria challenging, and liver biopsy may be required.
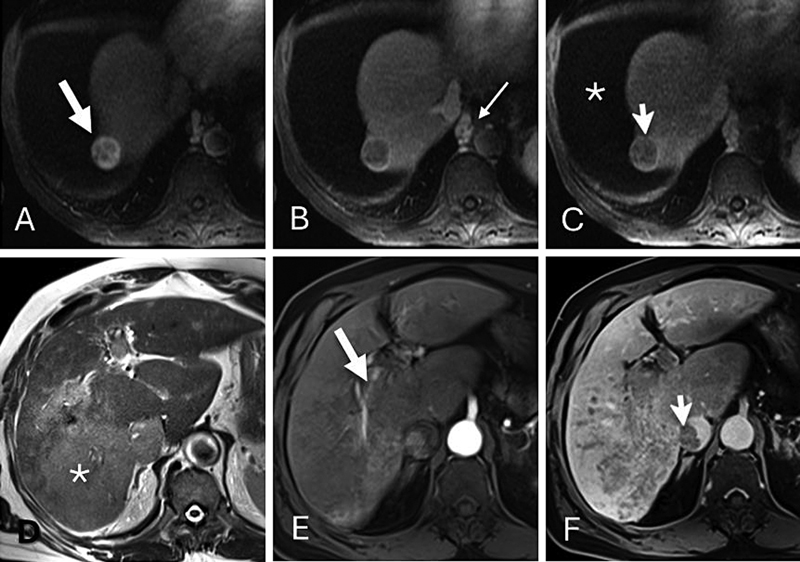
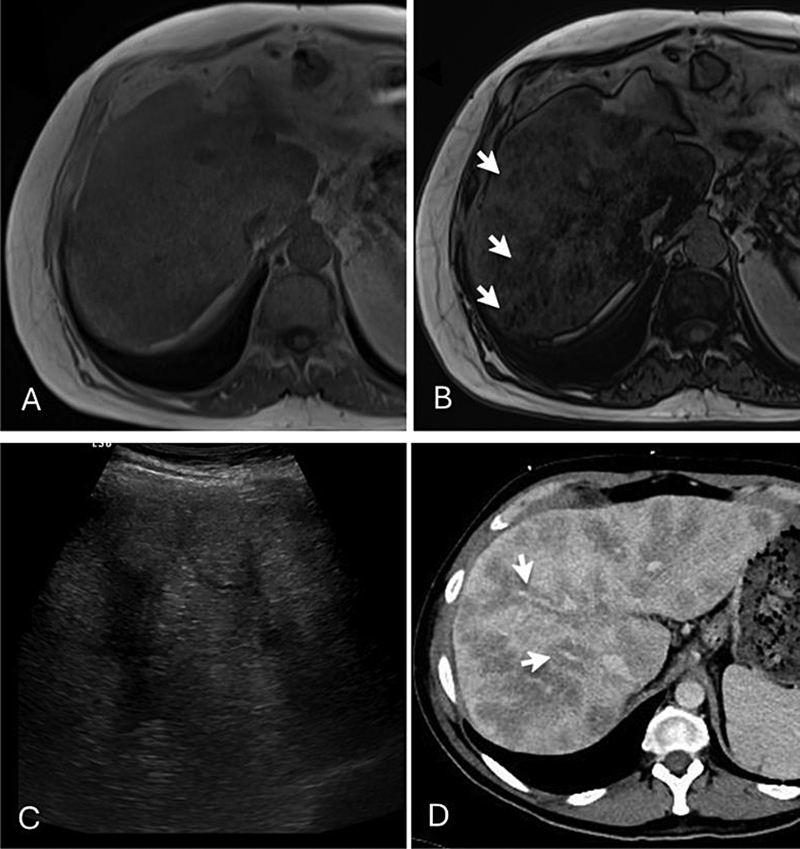
Alcohol-associated hepatitis (AH) often presents with acute-on-chronic liver failure and multi-organ failure, carrying a 50% 3-month mortality in severe cases.[62] Patients typically present to the emergency department with acute jaundice, with or without abdominal pain. Severe AH can be life-threatening with limited treatment options. Diagnosis is based on exclusion of drug-induced injury or ischemic hepatitis. CT/MRI may show fibrosis, cirrhosis, a dysmorphic liver, heterogeneous steatosis, and transient perfusion abnormalities, with focal areas mimicking tumor (pseudotumoral lesions) ([Fig. 19]).[63] These abnormalities are particularly prominent during arterial phase and the parenchyma becomes more homogenous in delayed phase. Recognizing these features is important to differentiate from mass lesions.

MRI may reveal heterogeneous steatosis and abnormal liver parenchyma on T2-weighted or DWI images. MRE may demonstrate elevated liver stiffness predominantly due to inflammation ([Fig. 19]). The acute presentation in patients with known AUD, heterogeneous liver parenchyma, and transient arterial phase perfusion changes is considered specific for severe AH.[63] Additional diagnostic pointers include lower body mass index, lack of visceral obesity due to malnutrition, and dysmorphic liver on CT or MRI. The association of alcoholic pancreatitis also suggests a strong possibility of AH.[24]
Patients with ALD are especially susceptible to infections due to compromised immunity from chronic alcohol use, disrupted intestinal barrier, and malnutrition. Patients with severe AH often receive steroids as lifesaving treatment, which further increases their infection risk. Hepatic abscesses can develop in patients with AUD ([Fig. 20]), and hepatic amebic abscesses may occur in those consuming indigenous alcoholic drinks.[64] Patients with severe AH have an increased susceptibility to invasive mycosis (aspergillosis and candidiasis) with high mortality.[65]

Spontaneous bacterial peritonitis (SBP) ([Fig. 21]) can occur in patients with decompensated ALD. The passage of bacteria from the gut to the bloodstream and other extraintestinal sites, and decreased host immunity secondary to alcohol have been implicated in the pathogenesis of SBP.[66] Findings that suggest SBP on imaging are mesenteric fat stranding and enhancing peritoneum; however, they are not specific. Other complications in decompensated include bleeding varices, hepatorenal syndrome (see below), hepatic encephalopathy, and hepatopulmonary syndrome.

Alcoholic Pancreatitis
Alcohol is metabolized in the pancreas through both oxidative and non-oxidative metabolic pathways. The metabolites cause changes in acinar cells, reducing enzyme secretion and stability of organelles that contain these enzymes and lysosomes. Chronic alcohol use can cause cytoplasmic lipid accumulation in the acinar cells, leading to fatty degeneration, cellular necrosis, and fibrosis. Long-term alcohol use alters pancreatic enzyme volume and viscosity, obstructs pancreatic ducts, and form proteinaceous plugs within the ducts.[67] In certain scenario, this can lead to premature intracellular activation of digestive enzymes, leading to pancreatitis.[68]
The AGA guidelines identify alcohol as a cause of acute pancreatitis (AP) when there is history of heavy alcohol consumption for more than 5 years, specifically over 50 g/day.[69] The risk of developing pancreatic injury or pancreatitis increases proportionally with the amount and duration of alcohol intake.[70] Although alcohol is a well-established risk factor for acute and chronic pancreatitis worldwide, including in India,[71] less than 5% of heavy drinkers develop pancreatitis.[72] This reasons for low incidence of alcoholic pancreatitis is not well understood, and several other factors like smoking, diet, and genetics are thought to play a role.[72] [73] Nevertheless, alcohol triggers pancreatitis and can lead to recurrent or chronic inflammation, fibrosis, and chronic pancreatitis (CP). After the first episode of AP, 25 to 50% develop recurrent pancreatitis, and 40 to 80% of those progress to CP.[74] Even a single episode can cause chronic changes, particularly in smokers.[75] Chronic unremitting pancreatitis can result in exocrine and endocrine insufficiencies.[68] [76] [77]
Diagnosis of AP relies on a history of AUD, which can be challenging to confirm. Contrast-enhanced CT is preferred during acute episodes, showing features like pancreatic swelling, decreased enhancement, or necrosis ([Fig. 22]) without an attributable cause like gallstones. MRI may be useful in patients with severe renal dysfunction.[78] Imaging may be useful to predict disease severity and course. Local complications occur at various stages: acute peripancreatic fluid collection and acute necrotic collection develop in less than 4 weeks ([Fig. 23]). Pancreatic pseudocyst or abscess and walled-off necrosis usually present after 4 weeks.[79] Uncommon complications include pseudoaneurysm formation, venous thrombosis, and fistulization between fluid collections, necrosis, and adjacent organs.


CP results from either chronic unremitting acute pancreatitis or multiple episodes of acute pancreatitis linked to binge or heavy drinking. Pancreatic necrosis from chronic alcohol consumption results in pancreatic atrophy. CP manifests on imaging with glandular atrophy, ductal dilatation, and calcifications ([Fig. 24]). Magnetic resonance cholangiopancreatography (MRCP) and secretin-enhanced MRCP are valuable for diagnosis of CP.[80] Although there are no specific imaging features attributable to alcohol, calcifications tend to occur early in the course of the disease and calculi are smaller compared with those in cystic fibrosis, tropical pancreatitis, and hereditary pancreatitis which are typically large (2–5 cm).[81] CP may be associated with both exocrine and endocrine deficiencies of the pancreas.

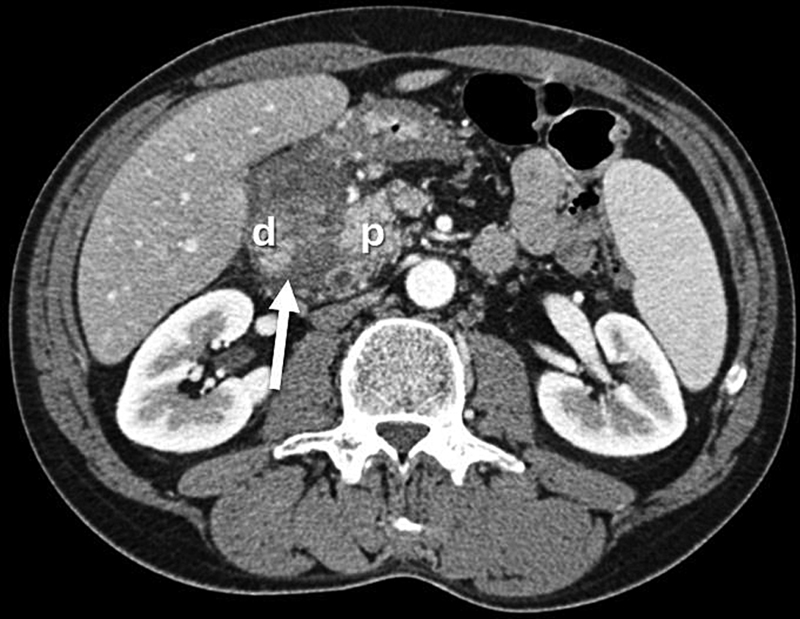
Groove pancreatitis, an uncommon form of pancreatitis that affects the pancreaticoduodenal groove between the head of pancreas, duodenum, and the common bile duct, is most closely associated with heavy alcohol consumption and tobacco use.[82] [83] Loss of fat plane between head of pancreas and duodenum and ill-defined crescentic soft tissue thickening are typical findings on CT in groove pancreatitis ([Fig. 25]). Delayed enhancement of soft tissue due to fibrosis, thickened medial duodenal wall, and cystic changes may be seen in chronic cases. MRI with superior soft tissue contrast may demonstrate these changes better. The soft tissue thickening needs to be differentiated from pancreatic carcinoma, duodenal carcinoma, gastrointestinal stromal tumor (GIST), intraductal papillary mucinous neoplasm (IPMN), and neoplasms arising in periampullary region.
Alcohol and Kidney
A direct causation between alcohol and chronic kidney injury is not established but chronic alcohol consumption is a well-known risk factor for kidney damage.[84] The alcohol-induced kidney injury is thought to be due to complex interaction between several mechanisms, including local production of ROS, endotoxins in circulation, increased IgA production and deposition in glomeruli, renal microcirculatory changes from hepatorenal syndrome, decreased renal blood flow from alcoholic cardiomyopathy, myoglobinuria from skeletal muscle damage, and activation of renin-angiotensin- aldosterone system.[85] However, moderate alcohol consumption is supposed to protect against cardiovascular disease and renal injury, highlighting the complex relationship between alcohol and kidneys.
Hepatorenal syndrome (HRS) typically occurs in patients with cirrhosis, characterized by marked impairment of kidney function in response to hemodynamic and circulatory changes due to cirrhosis. Clinically it manifests as marked reduction in glomerular filtration rate (GFR) in the absence of significant pathologic findings in kidney, frequently associated with failure of other organ/organ systems and potentially reversible with pharmacologic therapy or liver transplantation.[86] Two forms are recognized: HRS–acute kidney injury (HRS-AKI) and HRS–chronic kidney disease (HRS-CKD).[87] HRS-AKI almost exclusively occurs in patients with decompensated cirrhosis and ascites. Imaging of kidneys is important to exclude presence of other causes of renal dysfunction including atrophy. A normal renal imaging is a prerequisite for diagnosis of HRS-AKI.[87]
Alcohol and Endocrine Organs
The alcohol's effect on endocrine function is complex and has widespread consequences. Chronic exposure to alcohol is likely to impact the various endocrine organs. Alcohol's effect on endocrine system is thought to be mediated through nervous system and direct effect on the cells.[88] Alcohol intoxication via hypothalamus-mediated axis affects many endocrine organs including anterior pituitary, posterior pituitary, thyroid, adrenals, and gonads leading to metabolic dysfunction, body growth disorders, decreased libido, infertility, gonadal atrophy, thyroid disorders, and glucose metabolism.[88] Imaging is usually performed in patients with endocrine dysfunction to rule out structural or other causes of endocrine organ damage. Although alcohol does not cause diabetes, chronic AUD can increase the risk of developing diabetes as it can cause disruption of metabolic processes in liver, fluctuating levels of blood sugar levels, and weight gain, combined with alcohol-related pancreatic damage causing endocrine insufficiency.[77]
Conclusion
AUD is a severe condition that significantly impacts the organs and organ systems, particularly the liver, which is the primary organ responsible for its metabolism. Early diagnosis is crucial to prevent further damage and improve treatment outcomes. Although a detailed history of alcohol use is essential for diagnosis, imaging techniques such as MRI, CT, and ultrasound provide valuable insights into AUD-related complication, facilitating early detection and potentially improving health outcomes.
Radiologists play a critical role in identifying the manifestations of alcohol use associated diseases and disorders. By recognizing these signs, they can alert referring clinicians, prompting further clinical evaluation. This collaborative approach of radiologists and treating physicians helps reduce the morbidity and mortality associated with AUD, ensuring patients receive timely and appropriate care.
The imaging manifestations affecting the central nervous system, fetal health, cardiovascular system, musculoskeletal system, and alcohol-related trauma and cancers will be covered in part II.
Conflict of Interest
None declared.
Authors' Contributions
S.K.V.: concepts, design, definition of intellectual content, and guarantor of manuscript; M.J.N. and S.K.V.: manuscript preparation. All the authors were involved in literature search, manuscript editing, and manuscript review.
-
References
- 1 WHO. Global Status Report on Alcohol and Health and Treatment of Substance Use Disorders. Geneva; 2024
- 2 Jung F, Sánchez V, Brandt A, Bergheim I. Alcohol-related liver disease: also a question of what you drink?. Explor Dig Dis 2023; 2 (03) 118-132
- 3 Alcohol Use and Your Health. CDC. . Accessed November 21, 2025 at https://www.cdc.gov/alcohol/about-alcoholuse/index.html
- 4 Gururaj G, Gautham MS, Arvind BA. Alcohol consumption in India: a rising burden and a fractured response. Drug Alcohol Rev 2021; 40 (03) 368-384
- 5 Joseph AP, Babu A, Om Prakash LT. Redefining the approach to alcohol use disorder in India: a call for conventional to multidisciplinary and technologically innovative treatment strategies. Int J Soc Psychiatry 2024; 70 (07) 1349-1350
- 6 Eashwar VMA, Umadevi R, Gopalakrishnan S. Alcohol consumption in India—an epidemiological review. J Family Med Prim Care 2020; 9 (01) 49-55
- 7 Jones AW. Alcohol, its absorption, distribution, metabolism, and excretionin the body and pharmacokinetic calculations. WIREs Forensic Sci 2019; 1 (05) e1340
- 8 Zakhari S. Overview: how is alcohol metabolized by the body?. Alcohol Res Health 2006; 29 (04) 245-254
- 9 Palmer RB. A review of the use of ethyl glucuronide as a marker for ethanol consumption in forensic and clinical medicine. Semin Diagn Pathol 2009; 26 (01) 18-27
- 10 Staufer K, Yegles M. Biomarkers for detection of alcohol consumption in liver transplantation. World J Gastroenterol 2016; 22 (14) 3725-3734
- 11 Bode C, Bode JC. Alcohol's role in gastrointestinal tract disorders. Alcohol Health Res World 1997; 21 (01) 76-83
- 12 Kranzler HR, Babor TF, Goldstein L, Gold J. Dental pathology and alcohol-related indicators in an outpatient clinic sample. Community Dent Oral Epidemiol 1990; 18 (04) 204-207
- 13 Taraszewska A. Risk factors for gastroesophageal reflux disease symptoms related to lifestyle and diet. Rocz Panstw Zakl Hig 2021; 72 (01) 21-28
- 14 Pohl K, Moodley P, Dhanda AD. Alcohol's impact on the gut and liver. Nutrients 2021; 13 (09) 3170
- 15 Renu K, Myakala H, Chakraborty R. et al. Molecular mechanisms of alcohol's effects on the human body: a review and update. J Biochem Mol Toxicol 2023; 37 (12) e23502
- 16 Tameez Ud Din A, Alam F, Tameez-Ud-Din A, Chaudhary FMD. Auto-brewery syndrome: a clinical dilemma. Cureus 2020; 12 (10) e10983
- 17 Cordell BJ, Kanodia A, Miller GK. Case-control research study of auto-brewery syndrome. Glob Adv Health Med 2019; 8: 2164956119837566
- 18 Bishehsari F, Magno E, Swanson G. et al. Alcohol and gut-derived inflammation. Alcohol Res 2017; 38 (02) 163-171
- 19 Lu Y, Cederbaum AI. CYP2E1 and oxidative liver injury by alcohol. Free Radic Biol Med 2008; 44 (05) 723-738
- 20 Cederbaum AI, Lu Y, Wu D. Role of oxidative stress in alcohol-induced liver injury. Arch Toxicol 2009; 83 (06) 519-548
- 21 Mello T, Ceni E, Surrenti C, Galli A. Alcohol induced hepatic fibrosis: role of acetaldehyde. Mol Aspects Med 2008; 29 (1-2): 17-21
- 22 Stickel F, Datz C, Hampe J, Bataller R. Pathophysiology and management of alcoholic liver disease: update 2016. Gut Liver 2017; 11 (02) 173-188
- 23 Devarbhavi H, Asrani SK, Arab JP, Nartey YA, Pose E, Kamath PS. Global burden of liver disease: 2023 update. J Hepatol 2023; 79 (02) 516-537
- 24 Maheshwari S, Gu CN, Caserta MP. et al. Imaging of alcohol-associated liver disease. AJR Am J Roentgenol 2024; 222 (01) e2329917
- 25 Singal AK, Bataller R, Ahn J, Kamath PS, Shah VH. ACG clinical guideline: alcoholic liver disease. Am J Gastroenterol 2018; 113 (02) 175-194
- 26 Lane BP, Lieber CS. Ultrastructural alterations in human hepatocytes following ingestion of ethanol with adequate diets. Am J Pathol 1966; 49 (04) 593-603
- 27 Jophlin LL, Singal AK, Bataller R. et al. ACG clinical guideline: alcohol-associated liver disease. Am J Gastroenterol 2024; 119 (01) 30-54
- 28 Hirode G, Saab S, Wong RJ. Trends in the burden of chronic liver disease among hospitalized US adults. JAMA Netw Open 2020; 3 (04) e201997
- 29 Amonker S, Houshmand A, Hinkson A, Rowe I, Parker R. Prevalence of alcohol-associated liver disease: a systematic review and meta-analysis. Hepatol Commun 2023; 7 (05) e0133
- 30 OPTN. Organ Procurement and Transplantation Network (OPTN) and Scientific Registry of Transplant Recipients (SRTR). OPTN/SRTR 2021 Annual Data Report. U.S. Department of Health and Human Services, Health Resources and Services Administration; 2023. . Accessed June 30, 2023 at: http://srtr.transplant.hrsa.gov/annual_reports/Default.aspx
- 31 Crabb DW, Im GY, Szabo G, Mellinger JL, Lucey MR. Diagnosis and treatment of alcohol-associated liver diseases: 2019 practice guidance from the American Association for the Study of Liver Diseases. Hepatology 2020; 71 (01) 306-333
- 32 European Association for the Study of the Liver. EASL Clinical Practice Guidelines: management of alcohol-related liver disease. J Hepatol 2018; 69(1): 154-181
- 33 Bataller R, Cabezas J, Aller R. et al. Enfermedad hepática por alcohol. Guías de práctica clínica. Documento de consenso auspiciado por la AEEH. Gastroenterol Hepatol 2019; 42 (10) 657-676
- 34 Li YM, Fan JG, Wang BY. et al; Chinese Association for the Study of Liver Disease. Guidelines for the diagnosis and management of alcoholic liver disease: update 2010: (published in Chinese on Chinese Journal of Hepatology 2010; 18: 167-170). J Dig Dis 2011; 12 (01) 45-50
- 35 Baraona E, Lieber CS. Effects of ethanol on lipid metabolism. J Lipid Res 1979; 20 (03) 289-315
- 36 Moreno S, García-Samaniego J, Moreno A. et al. Noninvasive diagnosis of liver fibrosis in patients with HIV infection and HCV/HBV co-infection. J Viral Hepat 2009; 16 (04) 249-258
- 37 Yajima Y, Ohta K, Narui T, Abe R, Suzuki H, Ohtsuki M. Ultrasonographical diagnosis of fatty liver: significance of the liver-kidney contrast. Tohoku J Exp Med 1983; 139 (01) 43-50
- 38 Dasarathy S, Dasarathy J, Khiyami A, Joseph R, Lopez R, McCullough AJ. Validity of real time ultrasound in the diagnosis of hepatic steatosis: a prospective study. J Hepatol 2009; 51 (06) 1061-1067
- 39 Fetzer DT, Pierce TT, Robbin ML. et al. US quantification of liver fat: past, present, and future. Radiographics 2023; 43 (07) e220178
- 40 Ferraioli G, Gulizia R, Filice C. Real-time elastography in the assessment of liver fibrosis. AJR Am J Roentgenol 2007; 189 (03) W170
- 41 Thiele M, Rausch V, Fluhr G. et al. Controlled attenuation parameter and alcoholic hepatic steatosis: diagnostic accuracy and role of alcohol detoxification. J Hepatol 2018; 68 (05) 1025-1032
- 42 Thiele M, Detlefsen S, Sevelsted Møller L. et al. Transient and 2-dimensional shear-wave elastography provide comparable assessment of alcoholic liver fibrosis and cirrhosis. Gastroenterology 2016; 150 (01) 123-133
- 43 Huang Z, Zhou J, Lu X. et al. How does liver steatosis affect diagnostic performance of 2D-SWE.SSI: assessment from aspects of steatosis degree and pathological types. Eur Radiol 2021; 31 (05) 3207-3215
- 44 Yajima Y, Narui T, Ishii M. et al. Computed tomography in the diagnosis of fatty liver: total lipid content and computed tomography number. Tohoku J Exp Med 1982; 136 (03) 337-342
- 45 Ma X, Holalkere NS, Kambadakone R A, Mino-Kenudson M, Hahn PF, Sahani DV. Imaging-based quantification of hepatic fat: methods and clinical applications. Radiographics 2009; 29 (05) 1253-1277
- 46 Pickhardt PJ, Lubner MG. Noninvasive quantitative CT for diffuse liver diseases: steatosis, iron overload, and fibrosis. Radiographics 2025; 45 (01) e240176
- 47 Venkatesh SK, Yin M, Takahashi N, Glockner JF, Talwalkar JA, Ehman RL. Non-invasive detection of liver fibrosis: MR imaging features vs. MR elastography. Abdom Imaging 2015; 40 (04) 766-775
- 48 Guglielmo FF, Barr RG, Yokoo T. et al. Liver fibrosis, fat, and iron evaluation with MRI and fibrosis and fat evaluation with US: a practical guide for radiologists. Radiographics 2023; 43 (06) e220181
- 49 Tang A, Desai A, Hamilton G. et al. Accuracy of MR imaging-estimated proton density fat fraction for classification of dichotomized histologic steatosis grades in nonalcoholic fatty liver disease. Radiology 2015; 274 (02) 416-425
- 50 Hamer OW, Aguirre DA, Casola G, Sirlin CB. Imaging features of perivascular fatty infiltration of the liver: initial observations. Radiology 2005; 237 (01) 159-169
- 51 Hamer OW, Aguirre DA, Casola G, Lavine JE, Woenckhaus M, Sirlin CB. Fatty liver: imaging patterns and pitfalls. Radiographics 2006; 26 (06) 1637-1653
- 52 Horowitz JM, Nikolaidis P, Chen ZM. et al. Iron deposition surrounding the hepatic veins of cirrhotic patients on MRI. J Magn Reson Imaging 2011; 33 (03) 598-602
- 53 Marri UK, Madhusudhan KS. Perivenous hepatic iron deposition in chronic liver disease: MRI appearance. J Clin Exp Hepatol 2021; 11 (05) 628-629
- 54 Chen J, Allen AM, Therneau TM. et al. Liver stiffness measurement by magnetic resonance elastography is not affected by hepatic steatosis. Eur Radiol 2022; 32 (02) 950-958
- 55 Thiele M, Madsen BS, Hansen JF, Detlefsen S, Antonsen S, Krag A. Accuracy of the enhanced liver fibrosis test vs FibroTest, elastography, and indirect markers in detection of advanced fibrosis in patients with alcoholic liver disease. Gastroenterology 2018; 154 (05) 1369-1379
- 56 Moreno C, Mueller S, Szabo G. Non-invasive diagnosis and biomarkers in alcohol-related liver disease. J Hepatol 2019; 70 (02) 273-283
- 57 Idilman IS, Li J, Yin M, Venkatesh SK. MR elastography of liver: current status and future perspectives. Abdom Radiol (NY) 2020; 45 (11) 3444-3462
- 58 Rinella ME, Lazarus JV, Ratziu V. et al; NAFLD Nomenclature consensus group. A multisociety Delphi consensus statement on new fatty liver disease nomenclature. Hepatology 2023; 78 (06) 1966-1986
- 59 Marti-Aguado D, Calleja JL, Vilar-Gomez E. et al. Low-to-moderate alcohol consumption is associated with increased fibrosis in individuals with metabolic dysfunction-associated steatotic liver disease. J Hepatol 2024; 81 (06) 930-940
- 60 Lee YT, Wang JJ, Zhu Y, Agopian VG, Tseng HR, Yang JD. Diagnostic criteria and LI-RADS for hepatocellular carcinoma. Clin Liver Dis (Hoboken) 2021; 17 (06) 409-413
- 61 Thompson SM, Garg I, Ehman EC. et al. Non-alcoholic fatty liver disease-associated hepatocellular carcinoma: effect of hepatic steatosis on major hepatocellular carcinoma features at MRI. Br J Radiol 2018; 91 (1092) 20180345
- 62 Singal AK, Mathurin P. Diagnosis and treatment of alcohol-associated liver disease: a review. JAMA 2021; 326 (02) 165-176
- 63 Grillet F, Calame P, Cervoni JP. et al. Non-invasive diagnosis of severe alcoholic hepatitis: usefulness of cross-sectional imaging. Diagn Interv Imaging 2021; 102 (04) 247-254
- 64 Kumar Jha A, Jha P, Chaudhary M, Kumar S, Prakash V, Mohan Dayal V. The relation of toddy (palm wine) intake to amoebic liver abscess in a predominantly toddy-drinking population: a cross-sectional study. Trop Doct 2019; 49 (03) 197-200
- 65 Lahmer T, Messer M, Schwerdtfeger C. et al. Invasive mycosis in medical intensive care unit patients with severe alcoholic hepatitis. Mycopathologia 2014; 177 (3-4): 193-197
- 66 Biggins SW, Angeli P, Garcia-Tsao G. et al. Diagnosis, evaluation, and management of ascites, spontaneous bacterial peritonitis and hepatorenal syndrome: 2021 practice guidance by the American Association for the Study of Liver Diseases. Hepatology 2021; 74 (02) 1014-1048
- 67 Stevens T, Conwell DL, Zuccaro G. Pathogenesis of chronic pancreatitis: an evidence-based review of past theories and recent developments. Am J Gastroenterol 2004; 99 (11) 2256-2270
- 68 Apte MV, Pirola RC, Wilson JS. Mechanisms of alcoholic pancreatitis. J Gastroenterol Hepatol 2010; 25 (12) 1816-1826
- 69 Tenner S, Baillie J, DeWitt J, Vege SS. American College of Gastroenterology. American College of Gastroenterology guideline: management of acute pancreatitis. Am J Gastroenterol 2013; 108 (09) 1400-1415 , 1416
- 70 Rasineni K, Srinivasan MP, Balamurugan AN. et al. Recent advances in understanding the complexity of alcohol-induced pancreatic dysfunction and pancreatitis development. Biomolecules 2020; 10 (05) 669
- 71 Jana K, Ray S, Das R, Kumar D, Mandal TS, Das S. Alcoholic vs. non-alcoholic chronic pancreatitis: surgeons' perspective from a tertiary centre in India. Arq Bras Cir Dig 2021; 34 (02) e1595
- 72 Żorniak M, Sirtl S, Mayerle J, Beyer G. What do we currently know about the pathophysiology of alcoholic pancreatitis: a brief review. Visc Med 2020; 36 (03) 182-190
- 73 Takahashi T, Miao Y, Kang F, Dolai S, Gaisano HY. Susceptibility factors and cellular mechanisms underlying alcoholic pancreatitis. Alcohol Clin Exp Res 2020; 44 (04) 777-789
- 74 Machicado JD, Yadav D. Epidemiology of recurrent acute and chronic pancreatitis: similarities and differences. Dig Dis Sci 2017; 62 (07) 1683-1691
- 75 Sankaran SJ, Xiao AY, Wu LM, Windsor JA, Forsmark CE, Petrov MS. Frequency of progression from acute to chronic pancreatitis and risk factors: a meta-analysis. Gastroenterology 2015; 149 (06) 1490-1500.e1
- 76 Klöppel G, Zamboni G. Acute and chronic alcoholic pancreatitis, including paraduodenal pancreatitis. Arch Pathol Lab Med 2023; 147 (03) 294-303
- 77 Apte MV, Wilson JS. Alcohol-induced pancreatic injury. Best Pract Res Clin Gastroenterol 2003; 17 (04) 593-612
- 78 Manikkavasakar S, AlObaidy M, Busireddy KK. et al. Magnetic resonance imaging of pancreatitis: an update. World J Gastroenterol 2014; 20 (40) 14760-14777
- 79 Boxhoorn L, Voermans RP, Bouwense SA. et al. Acute pancreatitis. Lancet 2020; 396 (10252): 726-734
- 80 Xiao B, Zhang XM. Magnetic resonance imaging for acute pancreatitis. World J Radiol 2010; 2 (08) 298-308
- 81 Kamat R, Gupta P, Rana S. Imaging in chronic pancreatitis: state of the art review. Indian J Radiol Imaging 2019; 29 (02) 201-210
- 82 Okasha HH, Gouda M, Tag-Adeen M. et al. Clinical, radiological, and endoscopic ultrasound findings in groove pancreatitis: a multicenter retrospective study. Turk J Gastroenterol 2023; 34 (07) 771-778
- 83 Dahiya DS, Shah YR, Canakis A. et al. Groove pancreatitis: from enigma to future directions—a comprehensive review. J Gastroenterol Hepatol 2024; 39 (11) 2260-2271
- 84 Schaeffner E, Ritz E. Alcohol and kidney damage: a Janus-faced relationship. Kidney Int 2012; 81 (09) 816-818
- 85 Varga ZV, Matyas C, Paloczi J, Pacher P. Alcohol misuse and kidney injury: epidemiological evidence and potential mechanisms. Alcohol Res 2017; 38 (02) 283-288
- 86 Pose E, Piano S, Juanola A, Ginès P. Hepatorenal syndrome in cirrhosis. Gastroenterology 2024; 166 (04) 588-604.e1
- 87 Angeli P, Garcia-Tsao G, Nadim MK, Parikh CR. News in pathophysiology, definition and classification of hepatorenal syndrome: a step beyond the International Club of Ascites (ICA) consensus document. J Hepatol 2019; 71 (04) 811-822
- 88 Rachdaoui N, Sarkar DK. Pathophysiology of the effects of alcohol abuse on the endocrine system. Alcohol Res 2017; 38 (02) 255-276
Address for correspondence
Publication History
Article published online:
03 February 2026
© 2026. Indian Radiological Association. This is an open access article published by Thieme under the terms of the Creative Commons Attribution-NonDerivative-NonCommercial License, permitting copying and reproduction so long as the original work is given appropriate credit. Contents may not be used for commercial purposes, or adapted, remixed, transformed or built upon. (https://creativecommons.org/licenses/by-nc-nd/4.0/)
Thieme Medical and Scientific Publishers Pvt. Ltd.
A-12, 2nd Floor, Sector 2, Noida-201301 UP, India
-
References
- 1 WHO. Global Status Report on Alcohol and Health and Treatment of Substance Use Disorders. Geneva; 2024
- 2 Jung F, Sánchez V, Brandt A, Bergheim I. Alcohol-related liver disease: also a question of what you drink?. Explor Dig Dis 2023; 2 (03) 118-132
- 3 Alcohol Use and Your Health. CDC. . Accessed November 21, 2025 at https://www.cdc.gov/alcohol/about-alcoholuse/index.html
- 4 Gururaj G, Gautham MS, Arvind BA. Alcohol consumption in India: a rising burden and a fractured response. Drug Alcohol Rev 2021; 40 (03) 368-384
- 5 Joseph AP, Babu A, Om Prakash LT. Redefining the approach to alcohol use disorder in India: a call for conventional to multidisciplinary and technologically innovative treatment strategies. Int J Soc Psychiatry 2024; 70 (07) 1349-1350
- 6 Eashwar VMA, Umadevi R, Gopalakrishnan S. Alcohol consumption in India—an epidemiological review. J Family Med Prim Care 2020; 9 (01) 49-55
- 7 Jones AW. Alcohol, its absorption, distribution, metabolism, and excretionin the body and pharmacokinetic calculations. WIREs Forensic Sci 2019; 1 (05) e1340
- 8 Zakhari S. Overview: how is alcohol metabolized by the body?. Alcohol Res Health 2006; 29 (04) 245-254
- 9 Palmer RB. A review of the use of ethyl glucuronide as a marker for ethanol consumption in forensic and clinical medicine. Semin Diagn Pathol 2009; 26 (01) 18-27
- 10 Staufer K, Yegles M. Biomarkers for detection of alcohol consumption in liver transplantation. World J Gastroenterol 2016; 22 (14) 3725-3734
- 11 Bode C, Bode JC. Alcohol's role in gastrointestinal tract disorders. Alcohol Health Res World 1997; 21 (01) 76-83
- 12 Kranzler HR, Babor TF, Goldstein L, Gold J. Dental pathology and alcohol-related indicators in an outpatient clinic sample. Community Dent Oral Epidemiol 1990; 18 (04) 204-207
- 13 Taraszewska A. Risk factors for gastroesophageal reflux disease symptoms related to lifestyle and diet. Rocz Panstw Zakl Hig 2021; 72 (01) 21-28
- 14 Pohl K, Moodley P, Dhanda AD. Alcohol's impact on the gut and liver. Nutrients 2021; 13 (09) 3170
- 15 Renu K, Myakala H, Chakraborty R. et al. Molecular mechanisms of alcohol's effects on the human body: a review and update. J Biochem Mol Toxicol 2023; 37 (12) e23502
- 16 Tameez Ud Din A, Alam F, Tameez-Ud-Din A, Chaudhary FMD. Auto-brewery syndrome: a clinical dilemma. Cureus 2020; 12 (10) e10983
- 17 Cordell BJ, Kanodia A, Miller GK. Case-control research study of auto-brewery syndrome. Glob Adv Health Med 2019; 8: 2164956119837566
- 18 Bishehsari F, Magno E, Swanson G. et al. Alcohol and gut-derived inflammation. Alcohol Res 2017; 38 (02) 163-171
- 19 Lu Y, Cederbaum AI. CYP2E1 and oxidative liver injury by alcohol. Free Radic Biol Med 2008; 44 (05) 723-738
- 20 Cederbaum AI, Lu Y, Wu D. Role of oxidative stress in alcohol-induced liver injury. Arch Toxicol 2009; 83 (06) 519-548
- 21 Mello T, Ceni E, Surrenti C, Galli A. Alcohol induced hepatic fibrosis: role of acetaldehyde. Mol Aspects Med 2008; 29 (1-2): 17-21
- 22 Stickel F, Datz C, Hampe J, Bataller R. Pathophysiology and management of alcoholic liver disease: update 2016. Gut Liver 2017; 11 (02) 173-188
- 23 Devarbhavi H, Asrani SK, Arab JP, Nartey YA, Pose E, Kamath PS. Global burden of liver disease: 2023 update. J Hepatol 2023; 79 (02) 516-537
- 24 Maheshwari S, Gu CN, Caserta MP. et al. Imaging of alcohol-associated liver disease. AJR Am J Roentgenol 2024; 222 (01) e2329917
- 25 Singal AK, Bataller R, Ahn J, Kamath PS, Shah VH. ACG clinical guideline: alcoholic liver disease. Am J Gastroenterol 2018; 113 (02) 175-194
- 26 Lane BP, Lieber CS. Ultrastructural alterations in human hepatocytes following ingestion of ethanol with adequate diets. Am J Pathol 1966; 49 (04) 593-603
- 27 Jophlin LL, Singal AK, Bataller R. et al. ACG clinical guideline: alcohol-associated liver disease. Am J Gastroenterol 2024; 119 (01) 30-54
- 28 Hirode G, Saab S, Wong RJ. Trends in the burden of chronic liver disease among hospitalized US adults. JAMA Netw Open 2020; 3 (04) e201997
- 29 Amonker S, Houshmand A, Hinkson A, Rowe I, Parker R. Prevalence of alcohol-associated liver disease: a systematic review and meta-analysis. Hepatol Commun 2023; 7 (05) e0133
- 30 OPTN. Organ Procurement and Transplantation Network (OPTN) and Scientific Registry of Transplant Recipients (SRTR). OPTN/SRTR 2021 Annual Data Report. U.S. Department of Health and Human Services, Health Resources and Services Administration; 2023. . Accessed June 30, 2023 at: http://srtr.transplant.hrsa.gov/annual_reports/Default.aspx
- 31 Crabb DW, Im GY, Szabo G, Mellinger JL, Lucey MR. Diagnosis and treatment of alcohol-associated liver diseases: 2019 practice guidance from the American Association for the Study of Liver Diseases. Hepatology 2020; 71 (01) 306-333
- 32 European Association for the Study of the Liver. EASL Clinical Practice Guidelines: management of alcohol-related liver disease. J Hepatol 2018; 69(1): 154-181
- 33 Bataller R, Cabezas J, Aller R. et al. Enfermedad hepática por alcohol. Guías de práctica clínica. Documento de consenso auspiciado por la AEEH. Gastroenterol Hepatol 2019; 42 (10) 657-676
- 34 Li YM, Fan JG, Wang BY. et al; Chinese Association for the Study of Liver Disease. Guidelines for the diagnosis and management of alcoholic liver disease: update 2010: (published in Chinese on Chinese Journal of Hepatology 2010; 18: 167-170). J Dig Dis 2011; 12 (01) 45-50
- 35 Baraona E, Lieber CS. Effects of ethanol on lipid metabolism. J Lipid Res 1979; 20 (03) 289-315
- 36 Moreno S, García-Samaniego J, Moreno A. et al. Noninvasive diagnosis of liver fibrosis in patients with HIV infection and HCV/HBV co-infection. J Viral Hepat 2009; 16 (04) 249-258
- 37 Yajima Y, Ohta K, Narui T, Abe R, Suzuki H, Ohtsuki M. Ultrasonographical diagnosis of fatty liver: significance of the liver-kidney contrast. Tohoku J Exp Med 1983; 139 (01) 43-50
- 38 Dasarathy S, Dasarathy J, Khiyami A, Joseph R, Lopez R, McCullough AJ. Validity of real time ultrasound in the diagnosis of hepatic steatosis: a prospective study. J Hepatol 2009; 51 (06) 1061-1067
- 39 Fetzer DT, Pierce TT, Robbin ML. et al. US quantification of liver fat: past, present, and future. Radiographics 2023; 43 (07) e220178
- 40 Ferraioli G, Gulizia R, Filice C. Real-time elastography in the assessment of liver fibrosis. AJR Am J Roentgenol 2007; 189 (03) W170
- 41 Thiele M, Rausch V, Fluhr G. et al. Controlled attenuation parameter and alcoholic hepatic steatosis: diagnostic accuracy and role of alcohol detoxification. J Hepatol 2018; 68 (05) 1025-1032
- 42 Thiele M, Detlefsen S, Sevelsted Møller L. et al. Transient and 2-dimensional shear-wave elastography provide comparable assessment of alcoholic liver fibrosis and cirrhosis. Gastroenterology 2016; 150 (01) 123-133
- 43 Huang Z, Zhou J, Lu X. et al. How does liver steatosis affect diagnostic performance of 2D-SWE.SSI: assessment from aspects of steatosis degree and pathological types. Eur Radiol 2021; 31 (05) 3207-3215
- 44 Yajima Y, Narui T, Ishii M. et al. Computed tomography in the diagnosis of fatty liver: total lipid content and computed tomography number. Tohoku J Exp Med 1982; 136 (03) 337-342
- 45 Ma X, Holalkere NS, Kambadakone R A, Mino-Kenudson M, Hahn PF, Sahani DV. Imaging-based quantification of hepatic fat: methods and clinical applications. Radiographics 2009; 29 (05) 1253-1277
- 46 Pickhardt PJ, Lubner MG. Noninvasive quantitative CT for diffuse liver diseases: steatosis, iron overload, and fibrosis. Radiographics 2025; 45 (01) e240176
- 47 Venkatesh SK, Yin M, Takahashi N, Glockner JF, Talwalkar JA, Ehman RL. Non-invasive detection of liver fibrosis: MR imaging features vs. MR elastography. Abdom Imaging 2015; 40 (04) 766-775
- 48 Guglielmo FF, Barr RG, Yokoo T. et al. Liver fibrosis, fat, and iron evaluation with MRI and fibrosis and fat evaluation with US: a practical guide for radiologists. Radiographics 2023; 43 (06) e220181
- 49 Tang A, Desai A, Hamilton G. et al. Accuracy of MR imaging-estimated proton density fat fraction for classification of dichotomized histologic steatosis grades in nonalcoholic fatty liver disease. Radiology 2015; 274 (02) 416-425
- 50 Hamer OW, Aguirre DA, Casola G, Sirlin CB. Imaging features of perivascular fatty infiltration of the liver: initial observations. Radiology 2005; 237 (01) 159-169
- 51 Hamer OW, Aguirre DA, Casola G, Lavine JE, Woenckhaus M, Sirlin CB. Fatty liver: imaging patterns and pitfalls. Radiographics 2006; 26 (06) 1637-1653
- 52 Horowitz JM, Nikolaidis P, Chen ZM. et al. Iron deposition surrounding the hepatic veins of cirrhotic patients on MRI. J Magn Reson Imaging 2011; 33 (03) 598-602
- 53 Marri UK, Madhusudhan KS. Perivenous hepatic iron deposition in chronic liver disease: MRI appearance. J Clin Exp Hepatol 2021; 11 (05) 628-629
- 54 Chen J, Allen AM, Therneau TM. et al. Liver stiffness measurement by magnetic resonance elastography is not affected by hepatic steatosis. Eur Radiol 2022; 32 (02) 950-958
- 55 Thiele M, Madsen BS, Hansen JF, Detlefsen S, Antonsen S, Krag A. Accuracy of the enhanced liver fibrosis test vs FibroTest, elastography, and indirect markers in detection of advanced fibrosis in patients with alcoholic liver disease. Gastroenterology 2018; 154 (05) 1369-1379
- 56 Moreno C, Mueller S, Szabo G. Non-invasive diagnosis and biomarkers in alcohol-related liver disease. J Hepatol 2019; 70 (02) 273-283
- 57 Idilman IS, Li J, Yin M, Venkatesh SK. MR elastography of liver: current status and future perspectives. Abdom Radiol (NY) 2020; 45 (11) 3444-3462
- 58 Rinella ME, Lazarus JV, Ratziu V. et al; NAFLD Nomenclature consensus group. A multisociety Delphi consensus statement on new fatty liver disease nomenclature. Hepatology 2023; 78 (06) 1966-1986
- 59 Marti-Aguado D, Calleja JL, Vilar-Gomez E. et al. Low-to-moderate alcohol consumption is associated with increased fibrosis in individuals with metabolic dysfunction-associated steatotic liver disease. J Hepatol 2024; 81 (06) 930-940
- 60 Lee YT, Wang JJ, Zhu Y, Agopian VG, Tseng HR, Yang JD. Diagnostic criteria and LI-RADS for hepatocellular carcinoma. Clin Liver Dis (Hoboken) 2021; 17 (06) 409-413
- 61 Thompson SM, Garg I, Ehman EC. et al. Non-alcoholic fatty liver disease-associated hepatocellular carcinoma: effect of hepatic steatosis on major hepatocellular carcinoma features at MRI. Br J Radiol 2018; 91 (1092) 20180345
- 62 Singal AK, Mathurin P. Diagnosis and treatment of alcohol-associated liver disease: a review. JAMA 2021; 326 (02) 165-176
- 63 Grillet F, Calame P, Cervoni JP. et al. Non-invasive diagnosis of severe alcoholic hepatitis: usefulness of cross-sectional imaging. Diagn Interv Imaging 2021; 102 (04) 247-254
- 64 Kumar Jha A, Jha P, Chaudhary M, Kumar S, Prakash V, Mohan Dayal V. The relation of toddy (palm wine) intake to amoebic liver abscess in a predominantly toddy-drinking population: a cross-sectional study. Trop Doct 2019; 49 (03) 197-200
- 65 Lahmer T, Messer M, Schwerdtfeger C. et al. Invasive mycosis in medical intensive care unit patients with severe alcoholic hepatitis. Mycopathologia 2014; 177 (3-4): 193-197
- 66 Biggins SW, Angeli P, Garcia-Tsao G. et al. Diagnosis, evaluation, and management of ascites, spontaneous bacterial peritonitis and hepatorenal syndrome: 2021 practice guidance by the American Association for the Study of Liver Diseases. Hepatology 2021; 74 (02) 1014-1048
- 67 Stevens T, Conwell DL, Zuccaro G. Pathogenesis of chronic pancreatitis: an evidence-based review of past theories and recent developments. Am J Gastroenterol 2004; 99 (11) 2256-2270
- 68 Apte MV, Pirola RC, Wilson JS. Mechanisms of alcoholic pancreatitis. J Gastroenterol Hepatol 2010; 25 (12) 1816-1826
- 69 Tenner S, Baillie J, DeWitt J, Vege SS. American College of Gastroenterology. American College of Gastroenterology guideline: management of acute pancreatitis. Am J Gastroenterol 2013; 108 (09) 1400-1415 , 1416
- 70 Rasineni K, Srinivasan MP, Balamurugan AN. et al. Recent advances in understanding the complexity of alcohol-induced pancreatic dysfunction and pancreatitis development. Biomolecules 2020; 10 (05) 669
- 71 Jana K, Ray S, Das R, Kumar D, Mandal TS, Das S. Alcoholic vs. non-alcoholic chronic pancreatitis: surgeons' perspective from a tertiary centre in India. Arq Bras Cir Dig 2021; 34 (02) e1595
- 72 Żorniak M, Sirtl S, Mayerle J, Beyer G. What do we currently know about the pathophysiology of alcoholic pancreatitis: a brief review. Visc Med 2020; 36 (03) 182-190
- 73 Takahashi T, Miao Y, Kang F, Dolai S, Gaisano HY. Susceptibility factors and cellular mechanisms underlying alcoholic pancreatitis. Alcohol Clin Exp Res 2020; 44 (04) 777-789
- 74 Machicado JD, Yadav D. Epidemiology of recurrent acute and chronic pancreatitis: similarities and differences. Dig Dis Sci 2017; 62 (07) 1683-1691
- 75 Sankaran SJ, Xiao AY, Wu LM, Windsor JA, Forsmark CE, Petrov MS. Frequency of progression from acute to chronic pancreatitis and risk factors: a meta-analysis. Gastroenterology 2015; 149 (06) 1490-1500.e1
- 76 Klöppel G, Zamboni G. Acute and chronic alcoholic pancreatitis, including paraduodenal pancreatitis. Arch Pathol Lab Med 2023; 147 (03) 294-303
- 77 Apte MV, Wilson JS. Alcohol-induced pancreatic injury. Best Pract Res Clin Gastroenterol 2003; 17 (04) 593-612
- 78 Manikkavasakar S, AlObaidy M, Busireddy KK. et al. Magnetic resonance imaging of pancreatitis: an update. World J Gastroenterol 2014; 20 (40) 14760-14777
- 79 Boxhoorn L, Voermans RP, Bouwense SA. et al. Acute pancreatitis. Lancet 2020; 396 (10252): 726-734
- 80 Xiao B, Zhang XM. Magnetic resonance imaging for acute pancreatitis. World J Radiol 2010; 2 (08) 298-308
- 81 Kamat R, Gupta P, Rana S. Imaging in chronic pancreatitis: state of the art review. Indian J Radiol Imaging 2019; 29 (02) 201-210
- 82 Okasha HH, Gouda M, Tag-Adeen M. et al. Clinical, radiological, and endoscopic ultrasound findings in groove pancreatitis: a multicenter retrospective study. Turk J Gastroenterol 2023; 34 (07) 771-778
- 83 Dahiya DS, Shah YR, Canakis A. et al. Groove pancreatitis: from enigma to future directions—a comprehensive review. J Gastroenterol Hepatol 2024; 39 (11) 2260-2271
- 84 Schaeffner E, Ritz E. Alcohol and kidney damage: a Janus-faced relationship. Kidney Int 2012; 81 (09) 816-818
- 85 Varga ZV, Matyas C, Paloczi J, Pacher P. Alcohol misuse and kidney injury: epidemiological evidence and potential mechanisms. Alcohol Res 2017; 38 (02) 283-288
- 86 Pose E, Piano S, Juanola A, Ginès P. Hepatorenal syndrome in cirrhosis. Gastroenterology 2024; 166 (04) 588-604.e1
- 87 Angeli P, Garcia-Tsao G, Nadim MK, Parikh CR. News in pathophysiology, definition and classification of hepatorenal syndrome: a step beyond the International Club of Ascites (ICA) consensus document. J Hepatol 2019; 71 (04) 811-822
- 88 Rachdaoui N, Sarkar DK. Pathophysiology of the effects of alcohol abuse on the endocrine system. Alcohol Res 2017; 38 (02) 255-276