

Subscribe to RSS
DOI: 10.4103/ijri.IJRI_122_17
3T proton MR spectroscopy evaluation of spinal cord lesions
Authors
Financial support and sponsorship Nil.


Abstract
Objective: The objective of this study was to evaluate intramedullary spinal cord lesions using magnetic resonance spectroscopy and correlate the results with histo-pathological examination (HPE). Materials and Methods: Approval for this study was obtained from our institute ethical committee. Overall, 50 patients were recruited (29 male and 21 female), with a maximum age of 53 years and minimum age of 7 years. The mean age group of the study was 33 years. Standard magnetic resonance imaging (MRI) spine was done on a Siemens Skyra 3Tesla MRI scanner. MR Spectroscopy (MRS) was performed for all patients with intramedullary spinal lesions after getting written consent. It was performed using single-voxel method. The change in the metabolite peak was observed in each case and the results were compared with HPE. These collected data were analyzed using SPSS 16.0 version. Descriptive statistics, frequency analysis, and percentage analysis were used for categorical variables; and for continuous variables, mean and standard deviation were analyzed. McNemar's test was used to find the significance between conventional MRI MRS. In the above statistical tool, the probability value 0.05 is considered as significant level. Results: From our study, we observed that by applying routine MRI sequences alone, we could only detect around 58% of the cases correctly. However, when MRS was done along with the conventional MR imaging, the number of cases detected significantly increased to 84%. By applying McNemar's test and comparing the conventional MRI and MRS with HPE, it was found that statistically significant difference exists with P value of 0.007. Conclusion: MRS of the spinal cord is a promising tool for research and diagnosis because it can provide additional information complementary to other non-invasive imaging methods. It is an emerging tool and adds new biomarker information for characterization of spinal cord tumors, to differentiate benign from malignant lesions and to prevent unnecessary biopsies and surgeries.
Introduction
A spectrum of abnormalities may affect the spinal cord including developmental anomalies, inflammatory and infectious processes, vascular disease, degenerative conditions, as well as benign and malignant neoplasms. Patients with intramedullary spinal cord lesions commonly present with tingling pain, numbness, and weakness.
Magnetic resonance imaging (MRI) is the current imaging modality of choice in the evaluation of patients presenting with myelopathic symptoms in the search for spinal cord lesions. It is important to recognize and differentiate non-neoplastic from the neoplastic process of the spinal cord as differentiation of the two entities is extremely crucial to the neurosurgeon.
MR spectroscopy (MRS) is a non-invasive tool which helps characterize the chemical composition of human tissue. Thereby it can help better characterize pathologic processes affecting the spinal cord and helps provide important biomarkers for differential diagnosis.[1]
Rationale for the study
For several years, MRS has been applied in the investigation of pathologic processes involving the brain and has gained an increased acceptance by its potential in differentiating high- versus low-grade tumors, distinguishing tumor from non-tumoral tissue, differentiating solid lesions from cysts or abscesses,[2],[3] monitoring the results of treatment, and occasionally predicting outcome.[4],[5]
The information obtained by MRS helps differentiate benign versus malignant lesions [6] and may often prevent unnecessary invasive interventions such as surgery or biopsy. Thus, it can avoid further negative impact on patient outcome.
Materials and Methods
The study was approved by the institutional ethical clearance committee and informed written consent was obtained from all the patients and controls included in this study.
All subjects were screened with inclusion and exclusion criteria based on various neurological symptoms such as paraparesis, upper limb weakness, and back pain. Among these, only patients with intramedullary spinal cord lesions were included in this study. Patients with recurrent spinal lesions, previously operated spinal lesions, patients with contraindications for MRI (MRI-incompatible pacemaker, cochlear implant), non-consenting, and uncooperative patients were excluded from this study.
Clinical history and physical examination were obtained by evaluating neurosurgeon which included back pain, upper or lower limb weakness, and paraparesis. All the subjects were prospectively enrolled in the database for future collection of surveys and follow-ups. The goals of this investigation were focused on showing the value of MRS in the intramedullary spinal cord lesions and to compare the results with histopathological examination (HPE). This study was performed over a period of 1 year from 2015 to 2016.
MRI acquisition details
Standard 3T MRI of the spine was taken in T1 and T2 sagittal, T2 axial, and fat-suppressed T1 contrast sagittal images in a Siemens Skyra MRI Scanner. The location of lesion was identified and the characters of lesion such as solid/cystic, post contrast enhancement characters, any associated syrinx, and cord expansion were noted.
Single-voxel MRS was applied either in T2 sagittal or post contrast T1 sagittal fat-suppressed image. If the patient motion was identified, voxel position was updated and the measurement is repeated. The size of the voxel was adjusted according to the size of the lesion [7],[8],[9],[10],[11] and pulse gating was applied to reduce pulsation artifact. Echo Time (TE) was set at 135 and Repetion Time (TR) at 2000 ms.
The spectra were obtained with adequate homogeneity and fat suppression. The homogeneity was adequate. Manual shimming [12],[13],[14] was done in all cases and full width half maximum (FHWM) of 20 was obtained. Adequate fat suppression was obtained using chemical shift selective (CHESS) technique.
Further saturation bands were used around voxel, to avoid voxel bleeding and artifacts. Inner volume suppression bands [15],[16] were applied to minimize the chemical shift displacement artifact and to reduce the influence of cerebrospinal fluid pulsations. B0 shimming, inner outer volume suppression, fat water suppression [17] were done as part of the protocol. Slice thickness was 3 mm. This sequence lasts about 5 min. The saturation pulses above and below the spectroscopy voxel facilitated flow compensation.
The time taken for acquiring T1sagittal, T2 sagittal, T2 axial, post contrast imaging, and MRS image for patients with spinal lesion was approximately 30 min and spectral processing was carried out separately which took 5 min, including data transfer to a workstation.
In MRS, single-voxel shapes were applied using rectangle shape. MRS data were acquired and post processing was done to obtain good spectrum of metabolites. Integral values of metabolites in each intramedullary spinal cord lesions were obtained. These patients were followed up for their post-operative tissue biopsy and HPE results to compare the MRS findings. MRS was also done in normal subjects at cervical and dorsal levels for comparison and to detect the metabolite peaks.
Spinal magnetic resonance spectroscopy protocol
Overall, 50 patients were recruited (29 male and 21 female) [Table 1]. These subjects underwent standard MRI spine and MRS. Of these 50 patients, 22 patients were found to have malignant lesions. Twelve patients had histopathologically proven high-grade glioma and 10 patients had ependymoma. The remaining 28 patients were found to have benign lesions including intramedullary tuberculoma (9 patients), schwannoma (4 patients), dermoid cysts (2 patients), inflammatory lesions (7 patients) such as acute transverse myelitis, neuromyelitis optica, multiple sclerosis (3 patients), and spondylotic myelopathy (3 patients). Fifteen healthy subjects (8 male and 7 female) without any symptoms were taken as controls to find out spectrum of metabolites in a normal looking spinal cord at cervical and dorsal levels.
|
MRI spine |
TR |
2000ms |
|
T1 sagittal |
TE |
135 |
|
T2 sagittal |
Flip angle |
90degrees |
|
T2 axial |
SNR |
1 |
|
T1 post contrast |
Vector size |
1024 |
|
Band width |
1200Hz |
Statistical nalysis
The collected data were analyzed with SPSS 16.0 version (Statistical Package for Social Sciences, SPSS Inc., Chicago, IL, USA) software.
To find the significance between conventional MRI MRS, McNemar's test was used. Probability value of 0.05 was considered as significant level.
By applying conventional imaging alone, 58% of cases were detected correctly. When MRS was done along with conventional MRI, detection rate increased significantly to 84% as shown in [Table 2].
|
Frequency |
Percent |
Valid percent |
Cumulative percent |
|
|---|---|---|---|---|
|
Conventional |
||||
|
PET – Positron emission tomography |
||||
|
Valid |
||||
|
Yes |
29 |
58.0 |
58.0 |
58.0 |
|
No |
21 |
42.0 |
42.0 |
|
|
Total |
50 |
100.0 |
100.0 |
100.0 |
|
MRS |
||||
|
Valid |
||||
|
Yes |
42 |
84.0 |
84.0 |
84.0 |
|
No |
8 |
16.0 |
16.0 |
|
|
Total |
50 |
100.0 |
100.0 |
100.0 |
Frequency and Percentage Analysis
Comparison using McNemar's test
On comparing the conventional MRI sequences and MRS with HPE using McNemar's test, it was found that there was statistically significant difference between the above, with a P value of 0.007 as given in [Table 3].
|
Results |
Conventional MRI |
MRS |
|---|---|---|
|
Highly statistical significance with P <0.01 level |
||
|
YES |
29 |
42 |
|
NO |
21 |
8 |
|
P |
0.007 |
|
Results
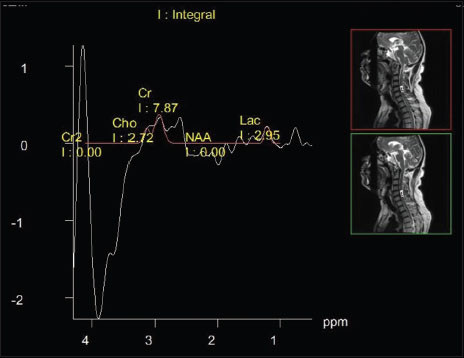
Our study shows that among the 15 normal subjects taken as controls, a mild increase in lactate peak was observed at 1.3 ppm in few subjects [Figure 1] and [Figure 2], whereas in other subjects, metabolites were within normal limits. In contrast to controls, spectra in different pathologies in spinal cord showed a distinct change in metabolite fingerprint.{Figure 1}{Figure 2}

-
In tuberculoma [Figure 3], [Figure 4], [Figure 5], [Figure 6], [Figure 7], [Figure 8], [Figure 9], [Figure 10], [Figure 11], [Figure 12], there was a significant increase in lipid and lactate with decreased NAA. Choline was not significantly increasedIn dermoid cyst [Figure 13], [Figure 14], [Figure 15], [Figure 16], [Figure 17], [Figure 18], [Figure 19], we found lipids mixed with lactate lactate was also clearly elevated at 1.3 ppmIn Ependymoma choline was significantly increased, NAA decreased, and lactate not very much decreased. In three patients, we observed significant increase in the creatine peak at 3.9 ppmIn low-grade glioma [Figure 20], [Figure 21], [Figure 22], [Figure 23], [Figure 24], NAA decreased, lactate mildly increased, and creatine and choline significantly increasedIn glioblastoma multiforme [Figure 25], [Figure 26], [Figure 27], [Figure 28], [Figure 29], choline was increased, NAA decreased, and creatinewas almost zeroIn multiple sclerosis and other inflammatory lesions, a significant reduction in NAA was observed.


Discussion
Spinal MRS at higher field strengths (3 Tesla and above) provides increased signal-to-noise ratio (SNR) and can address increased B0 and B1 inhomogeneity problems,[18] encountered in lower field strengths.
The major objectives of this study were to examine the cellular changes that occur in patients with spinal cord lesions and to assess the feasibility of MRS to provide cellular biomarkers that could be used to differentiate spinal cord lesions.
The study protocol including T1 sagittal, T2 axial and sagittal, postcontrast, and MRS took around 30 minutes.
Spinal cord lesions are an important cause of morbidity and mortality. The need to differentiate tumors from tumor mimics is important for clinical management. MRS can provide information regarding cellular biochemical function in spinal cord. In our study, we evaluated the metabolite integral values in various spinal cord lesions and correlated these findings with histopathology.
Elevated choline was nearly always been observed in many malignant lesions such as astrocytoma. In case of benign lesions such as tuberculomas, lipid lactate peak [Figure 5] was mainly observed. In inflammatory conditions such as multiple sclerosis, reduction in N-acetyl aspartate with absence of choline was observed.
Comparison using McNemar's test
From our study, we observed that by applying conventional MRI alone, we could only correctly detect around 58% cases, whereas when MRS was done along with conventional MRI, the number of cases detected is significantly increased to 84%. It is worth emphasizing that even in statistical analysis by applying McNemar's test and by comparing conventional MRI and MRS with HPE, it was found that statistically significant difference exists with P value of 0.007.
Our MRS findings in tuberculosis, dermoid cyst, and ependymoma also matched with those reported by Kim [19] They reported spinal MRS changes similar to changes seen in brain MRS; however, they did not show quantification with metabolite ratios.
We found the presence of lipid signals within spinal cord even in normal controls [Figure 1], [Figure 2] and [Figure 30]. It is difficult to determine whether this is due to contamination from surrounding tissues or because of intrinsic properties.

However, elevated lipid peaks in a homogeneously enhancing intramedullary lesion was found be a strong predictor of tuberculoma [Figure 4], whereas elevated choline integral values in an intramedullary lesion were detected in tumors.
However, more studies with high spectral quality in larger patient cohorts are needed to increase diagnostic confidence in differentiation of intramedullary tumors and to enhance specific differential diagnoses or to provide a tool for monitoring the course of a disease.
Limitations
Spinal MRS is not as straightforward as brain spectroscopy, and the results are affected by several factors such as susceptibility changes due to anatomic in-homogeneity and small size of spinal cord for single-voxel placement. The spectral quality is also affected by cerebrospinal fluid (CSF) flow and cardiac and respiratory motion. These could be reduced to a certain extent by use of pulse gating in all cases.
In MRS, single-voxel shapes were applied using rectangle shape. It was difficult to include a region of interest in a normal appearing spinal cord fully on any imaging plane. In some cases, it produced potential partial volume effect or signal contamination from surrounding tissue.
Conclusion
MRS of the spinal cord is a valuable noninvasive tool for research and diagnosis because it can provide additional information in which it is complementary to other noninvasive imaging methods. It is also an emerging tool which adds new biomarker information to characterize the spinal cord tumors, to differentiate benign and malignant lesions and thereby help prevent unnecessary biopsies and surgeries. However, the application of MRS in the spinal cord is not straightforward, and great care is required to attain optimal spectral quality.
The presence of lipid peak in a homogeneously enhancing intramedullary lesion with T2 hyperintensities provides a potential useful radiological biomarker of tuberculoma of spinal cord and can prevent unnecessary interventions.
Conflict of Interest
There are no conflicts of interest.
-
References
- 1 Abul-Kasim K, Thurner MM, McKeever P, Sundgren PC. Intradural spinal tumours: current classification and MRI features. Neuroradiology 2008; 50: 301-14
- 2 Seo HS, Kim JH, Lee DH, Lee YH, Suh SI, Kim SY. et al Non enhancing intramedullary astrocytomas and other MR imaging features: A retrospective study and systematic review. Am J Neuroradiol 2010; 31: 498-503
- 3 Preul MC, Caramanos Z, Collins DL, Villemure JG, Leblanc R, Olivier A. et al. Accurate, noninvasive diagnosis of human brain tumors by using proton magnetic resonance spectroscopy. Nat Med 1996; 2: 323-5
- 4 Kollias S, Goldstein R, Cogen P, Filly RA. Prenatally detected myelomeningoceles: sonographic accuracy in estimation of the spinal level. Radiology 1992; 185: 109-12
- 5 Dydak U, Kollias S, Schär M, Meier D, Boesiger P. et al. MR spectroscopy in different regions of the spinal cord and in spinal cord tumours. In: Proceedings of the Annual Meeting of the International Society of Magnetic Resonance in Medicine, Miami Beach, FL. USA 2005; p: 813
- 6 Baker KB, Moran CJ, Wippold FJ, Smirniotopoulos JG, Rodriguez FJ, Meyers SP. et al. MR imaging of spinal hemangioblastoma. Am J Roentgenol 2000; 174: 377-82
- 7 Marliani AF, Clementi V, Babu Peter S, Agati R, Carpenzano M, Salvi F. et al. Quantitative cervical spinal cord 3T proton MR spectroscopy in multiple sclerosis. Am J Neuroradiol 2010; 31: 180-4
- 8 Henning A, Schär M, Kollias SS, Boesiger P, Dydak U. Quantitative magnetic resonance spectroscopy in the entire human cervical spinal cord and beyond at 3T. Magn Reson Med 2008; 59: 1250-8
- 9 Kendi AT, Tan FU, Kendi M, Yilmaz S, Huvaj S, Tellioğlu S. et al. MR spectroscopy of cervical spinal cord in patients with multiple sclerosis. Nauroradiol 2004; 46: 764-9
- 10 Henning A, Schär M, Kollias SS, Boesiger P, Dydak U. Quantitative magnetic resonance spectroscopy in the entire human cervical spinal cord and beyond at 3T. Magn Reson Med 2008; 59: 1250-8
- 11 Loth F, Yardimci MA, Alperin N. Hydrodynamic modeling of cerebrospinal fluid motion within the spinal cavity. J Biomech Eng 2001; 123: 71-9
- 12 Freitas B, Holly LT, Mc Arthur DL, Salamon N. Proton magneticresonance spectroscopy to evaluate spinal cord axonal injury in cervical spondylotic myelopathy. J Neurosurg Spine 2009; 10: 194-200
- 13 Rapalino O, Law M, Salibi N JS Babb, Smith, Hesse L. Metabolite changes from MR spectroscopy in the cervical spinal cord in patients with cervical spondylosis. In: Proceedings of the AnnualMeeting of theInternational Society of Magnetic Resonance in Medicine, Seattle, Washington, DC. 2006 May 6–12. p. 3139.
- 14 Cooke FJ, Blamire AM, Manners DN, Styles P, Rajagopalan B. et al. Quantitative proton magnetic resonance spectroscopy of the cervical spinal cord. MagnReson Med 2004; 51: 1122-8
- 15 Carew JD, Nair G, Pineda-Alonso N, Usher S, Hu X, Benatar M. et al. Magnetic resonance spectroscopy of the cervical cord in amyotrophic lateral sclerosis. Amyotroph Lateral Scler 2011; 12: 185
- 16 De Vita E, Kachramanoglou C, Wheeler-Kingshott CA. Spinal cord 1H-MR spectroscopy in patients after brachial plexus root reimplantation. In: Proceedings of the Annual Meeting of the International Society of Magnetic Resonance in Medicine, Montreal, Quebec, Canada. 2011;May 7-13, p. 4290.
- 17 Smith AB, Soderlund KA, Rushing EJ, Smirniotopolous JG. Radiologic and pathologic correlation of pediatric and adolescent spinal neoplasms: Part 1, intramedullary spinal neoplasm. Am J Roentgenol 2012; 198: 34-43
- 18 Hock A, Henning A, Boesiger P, Kollias SS.. 1H-MR spectroscopy in the human spinal cord. Am J Neuroradiol 2013; 34: 1682-9
- 19 Kim YG, Choi GH, Kim DH, Kim YD, Kang YK, Kim J. et al. In vivo proton magnetic resonance spectroscopy of human spinal mass lesions. J Spinal DisordTech 2004; 17: 405-11
Address for correspondence
Publication History
Article published online:
26 July 2021
© 2018. Indian Radiological Association. This is an open access article published by Thieme under the terms of the Creative Commons Attribution-NonDerivative-NonCommercial-License, permitting copying and reproduction so long as the original work is given appropriate credit. Contents may not be used for commercial purposes, or adapted, remixed, transformed or built upon. (https://creativecommons.org/licenses/by-nc-nd/4.0/).
Thieme Medical and Scientific Publishers Pvt. Ltd.
A-12, 2nd Floor, Sector 2, Noida-201301 UP, India
-
References
- 1 Abul-Kasim K, Thurner MM, McKeever P, Sundgren PC. Intradural spinal tumours: current classification and MRI features. Neuroradiology 2008; 50: 301-14
- 2 Seo HS, Kim JH, Lee DH, Lee YH, Suh SI, Kim SY. et al Non enhancing intramedullary astrocytomas and other MR imaging features: A retrospective study and systematic review. Am J Neuroradiol 2010; 31: 498-503
- 3 Preul MC, Caramanos Z, Collins DL, Villemure JG, Leblanc R, Olivier A. et al. Accurate, noninvasive diagnosis of human brain tumors by using proton magnetic resonance spectroscopy. Nat Med 1996; 2: 323-5
- 4 Kollias S, Goldstein R, Cogen P, Filly RA. Prenatally detected myelomeningoceles: sonographic accuracy in estimation of the spinal level. Radiology 1992; 185: 109-12
- 5 Dydak U, Kollias S, Schär M, Meier D, Boesiger P. et al. MR spectroscopy in different regions of the spinal cord and in spinal cord tumours. In: Proceedings of the Annual Meeting of the International Society of Magnetic Resonance in Medicine, Miami Beach, FL. USA 2005; p: 813
- 6 Baker KB, Moran CJ, Wippold FJ, Smirniotopoulos JG, Rodriguez FJ, Meyers SP. et al. MR imaging of spinal hemangioblastoma. Am J Roentgenol 2000; 174: 377-82
- 7 Marliani AF, Clementi V, Babu Peter S, Agati R, Carpenzano M, Salvi F. et al. Quantitative cervical spinal cord 3T proton MR spectroscopy in multiple sclerosis. Am J Neuroradiol 2010; 31: 180-4
- 8 Henning A, Schär M, Kollias SS, Boesiger P, Dydak U. Quantitative magnetic resonance spectroscopy in the entire human cervical spinal cord and beyond at 3T. Magn Reson Med 2008; 59: 1250-8
- 9 Kendi AT, Tan FU, Kendi M, Yilmaz S, Huvaj S, Tellioğlu S. et al. MR spectroscopy of cervical spinal cord in patients with multiple sclerosis. Nauroradiol 2004; 46: 764-9
- 10 Henning A, Schär M, Kollias SS, Boesiger P, Dydak U. Quantitative magnetic resonance spectroscopy in the entire human cervical spinal cord and beyond at 3T. Magn Reson Med 2008; 59: 1250-8
- 11 Loth F, Yardimci MA, Alperin N. Hydrodynamic modeling of cerebrospinal fluid motion within the spinal cavity. J Biomech Eng 2001; 123: 71-9
- 12 Freitas B, Holly LT, Mc Arthur DL, Salamon N. Proton magneticresonance spectroscopy to evaluate spinal cord axonal injury in cervical spondylotic myelopathy. J Neurosurg Spine 2009; 10: 194-200
- 13 Rapalino O, Law M, Salibi N JS Babb, Smith, Hesse L. Metabolite changes from MR spectroscopy in the cervical spinal cord in patients with cervical spondylosis. In: Proceedings of the AnnualMeeting of theInternational Society of Magnetic Resonance in Medicine, Seattle, Washington, DC. 2006 May 6–12. p. 3139.
- 14 Cooke FJ, Blamire AM, Manners DN, Styles P, Rajagopalan B. et al. Quantitative proton magnetic resonance spectroscopy of the cervical spinal cord. MagnReson Med 2004; 51: 1122-8
- 15 Carew JD, Nair G, Pineda-Alonso N, Usher S, Hu X, Benatar M. et al. Magnetic resonance spectroscopy of the cervical cord in amyotrophic lateral sclerosis. Amyotroph Lateral Scler 2011; 12: 185
- 16 De Vita E, Kachramanoglou C, Wheeler-Kingshott CA. Spinal cord 1H-MR spectroscopy in patients after brachial plexus root reimplantation. In: Proceedings of the Annual Meeting of the International Society of Magnetic Resonance in Medicine, Montreal, Quebec, Canada. 2011;May 7-13, p. 4290.
- 17 Smith AB, Soderlund KA, Rushing EJ, Smirniotopolous JG. Radiologic and pathologic correlation of pediatric and adolescent spinal neoplasms: Part 1, intramedullary spinal neoplasm. Am J Roentgenol 2012; 198: 34-43
- 18 Hock A, Henning A, Boesiger P, Kollias SS.. 1H-MR spectroscopy in the human spinal cord. Am J Neuroradiol 2013; 34: 1682-9
- 19 Kim YG, Choi GH, Kim DH, Kim YD, Kang YK, Kim J. et al. In vivo proton magnetic resonance spectroscopy of human spinal mass lesions. J Spinal DisordTech 2004; 17: 405-11