

RSS-Feed abonnieren
DOI: 10.1055/a-1167-8402
AI in Radiology: Where are we today in Multiple Sclerosis Imaging?
Artikel in mehreren Sprachen: English | deutschAutor*innen

Abstract
Background MR imaging is an essential component in managing patients with Multiple sclerosis (MS). This holds true for the initial diagnosis as well as for assessing the clinical course of MS. In recent years, a growing number of computer tools were developed to analyze imaging data in MS. This review gives an overview of the most important applications with special emphasis on artificial intelligence (AI).
Methods Relevant studies were identified through a literature search in recognized databases, and through parsing the references in studies found this way. Literature published as of November 2019 was included with a special focus on recent studies from 2018 and 2019.
Results There are a number of studies which focus on optimizing lesion visualization and lesion segmentation. Some of these studies accomplished these tasks with high accuracy, enabling a reproducible quantitative analysis of lesion loads. Some studies took a radiomics approach and aimed at predicting clinical endpoints such as the conversion from a clinically isolated syndrome to definite MS. Moreover, recent studies investigated synthetic imaging, i. e. imaging data that is not measured during an MR scan but generated by a computer algorithm to optimize the contrast between MS lesions and brain parenchyma.
Conclusion Computer-based image analysis and AI are hot topics in imaging MS. Some applications are ready for use in clinical routine. A major challenge for the future is to improve prediction of expected disease courses and thereby helping to find optimal treatment decisions on an individual level. With technical improvements, more questions arise about the integration of new tools into the radiological workflow.
Key Points:
-
Computer algorithms have a growing impact on analyzing MR imaging in MS.
-
Artificial intelligence is more and more commonly employed in such computer tools.
-
Applications include lesion segmentation, prediction of clinical parameters and image synthesizing.
Citation Format
-
Eichinger P, Zimmer C, Wiestler B. AI in Radiology: Where are we today in Multiple Sclerosis Imaging?. Fortschr Röntgenstr 2020; 192: 847 – 853
Introduction
Multiple sclerosis (MS) is a neurological disease characterized by autoimmune-mediated episodes in many patients, particularly in the early stages of the disease [1]. MRI examinations reveal corresponding parenchyma lesions of the central nervous system. On the one hand, this means that imaging plays an important role in the diagnosis according to the current McDonald criteria [2], and on the other hand, imaging of inflammatory lesions allows the progression of the disease activity to be observed. In addition to lesion diagnosis, other MRI parameters such as atrophy rates [3] are increasingly used to characterize the course of the disease. Accordingly, MRI examinations have been established as an important tool for monitoring the effectiveness of immunomodulatory therapy. Imaging evidence of disease activity opens up the possibility of a change in therapy even before clinically detectable deterioration [4].
The evaluation of MRI imaging in MS is therefore a very common task in the (neuro)radiological routine. The questions relevant for monitoring the course of the disease are clearly defined (How has the lesion burden developed? Are there signs of increasing atrophy?), and codified accordingly in the NEDA criteria (No Evidence of Disease Activity) [3]. As a result of this standardization as well as the high quantity of MRI data sets collected, MS has become one of the pathologies for which computer-assisted evaluation of imaging is increasingly important. With the growing popularity of deep learning [5] and a generally expanded interest in artificial intelligence (AI), this development has further accelerated.
The aim of this study is to provide an overview of recently published examples of the application of computer algorithms in the context of MS imaging. The main focus is on studies from the field of AI [6].
Technical Background
Conventional CAD (computer-aided diagnosis) applications employ an algorithm programmed explicitly with expert knowledge in order to solve a specific problem. In contrast, machine learning provides a rough architecture of the algorithm, but the exact design is “learned” from it. This requires training data which are used to gradually configure the parameters of the algorithm. With respect to this review article, three types of machine learning algorithms are of particular importance: support-vector machines, random forest models and artificial neural networks.
Support-vector machines (SVM) are designed for classification problems, but can also be used for regression tasks [7]. For this purpose, the training data are interpreted as points in a data space. In the simplest case, this would be one plane, i. e. an x-y diagram. In this example, a straight line is then calculated that separates these data points according to their class. In general, where the data is available as a complex vector, a higher-dimensional analog of such a separation line is calculated accordingly.
Random forest models [8] use a classification algorithm to create a group of uncorrelated decision trees, the convergence of which predicts the result. Using this architecture, such algorithms are likewise tailored to classification problems, but can also solve regression problems.
Artificial neural networks are multi-layered networks of artificial neurons which only remotely resemble their biological models. Ultimately, they only contain an instruction on how to generate an output from several inputs. The parameters within a neural network to be adapted in the learning process are the connection strengths among the individual neurons. The concept “deep learning”, which is frequently used, refers to artificial neural networks that go beyond a few individual layers; however, this concept is not strictly defined [9]. An essential difference between SVM and random-forest models on the one hand and artificial neural networks on the other is that in the former models, the features (i. e. image properties translated into quantitative values) supporting the algorithms are determined in advance. Artificial neural networks, however, are not limited to predefined features, but “learn” relevant image properties independently in the training process.
Literature Search
The studies considered in this review were identified by a literature search using PubMed (https://www.ncbi.nlm.nih.gov/pubmed/) which included articles which had been published as of November 30, 2019. Special attention was paid to recent studies from the years 2018 and 2019. The search terms used included “multiple sclerosis” and “MRI” and “neuroimaging”, respectively, in connection with “artificial intelligence”, “machine learning” and “neural networks”. In addition, the bibliographies of the articles thus were searched for further matching titles.
Literature Search Results: Application of AI with respect to Multiple Sclerosis
Lesion Detection and Segmentation
One of the radiological core tasks in the evaluation of MS imaging, the manual analysis of lesion data for new or enlarged lesions, is arduous and prone to errors. In contrast, automatic segmentation offers the possibility of using objective parameters such as directly detecting lesion volumes. Therefore, many studies are concerned with either better visualization or even direct segmentation of these lesions. A strategy for comparing two studies is the generation of subtraction maps [10] [11], a process in which two MRI sequences are co-registered and then the intensity values are subtracted voxel by voxel. Applied to the comparison of a follow-up MRI with a reference examination, maps can be generated that directly visualize newly occurring lesions ([Fig. 1]). This technique can significantly increase the sensitivity in the detection of new lesions while reducing the time needed to compare the two examinations by a factor of 3 [11]. Subtraction maps, as an example of conventional tools, demonstrate that even relatively simple computer algorithms can significantly support routine radiological work. In projects based directly on this technology, it has been shown that the administration of contrast can no longer contribute to a further increase in sensitivity in the detection of newly occurring lesions [12]. In addition, subtraction maps were used to show the equivalence of an innovative accelerated double inversion recovery (DIR) sequence with a conventionally-acquired DIR sequence [13].

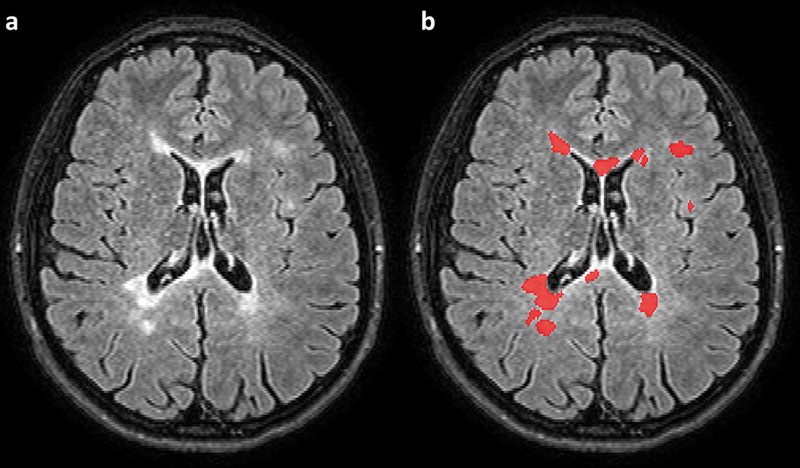
For many years lesion segmentation has been studied using various techniques; a compilation of earlier publications can be found, for example, in Schmidt et al. [14]. This paper also presented a proprietary tool for segmentation of MS lesions, which as well as studies presented here are based on conventional programming methods. In a recent review article, Danelakis et al. specifically address the topic of lesion segmentation and also consider AI studies [15]. An example of such a recent study is by Li et al. [16] which is based on a so-called U-Net [17]. This is a particular type of deep learning network that has proven to be particularly powerful for segmentation tasks. The paper by Li et al. concerns the segmentation of white matter hyperintensity associated with cerebral microangiopathy. Since segmentation of microangiopathic lesions and MS lesions are very similar tasks, this algorithm can also be applied to MRI examinations with adapted MS training data. [Fig. 2] shows an example of segmentation obtained in this way. A recent study by Gabr et al. [18] likewise used a U-Net for segmenting MS data sets. The special feature of this paper is that it is based on a very large collective of more than 1000 MRI examinations conducted in the course of a multi-center phase 3 study. In addition, this study also presents the segmentation of brain volume by means of a U-Net which also allows the automated determination of atrophy rates.
Integration of Clinical Data
The procedures described so far address questions inherent to imaging. In contrast, many studies also pursue the goal of using machine learning methods to capture information in image data that is not directly accessible to radiological-visual evaluation, thus enabling new issues to be addressed [19]. MRI imaging can help to make a reliable diagnosis at a very early stage (depending on the constellation present at the first manifestation) [2]. However, there is often a situation where a clinical event is considered a possible first episode of MS, but no definitive diagnosis can yet be made. Such a constellation is called a clinically isolated syndrome (CIS) [20]. Frequently a CIS develops into a positive case of MS [21]. Patients with a high risk of conversion should at least be closely monitored and, if necessary, receive immunomodulatory treatment at a very early stage [22] [23]. Therefore, prediction of individual conversion risk is clinically highly relevant. Several studies have investigated whether AI procedures can now be used to predict subsequent conversion or non-conversion in CIS patients based on initial imaging. Zhang et al. [24] used a random forest model based on brightness and shape features of the lesions in the initial MRI examination. Only shape properties of the lesions contributed to improved prediction, especially those that directly or indirectly describe the ovality of the lesions. However, features based on the intensity distribution of the lesions did not improve the prediction accuracy. Berndfeldt et al. [25] investigated the same question using an SVM method, including lesion geometry, clinical and demographic data, as well as gray matter volume. This study also demonstrated a significant contribution of lesion geometry to classification accuracy. These results reflect the fact that MS lesions often appear ovoid (“Dawson finger”). Thus, the decision making of these tools correlates with already known lesion properties, which makes the behavior of the algorithms transparently reasonable.
Other issues already addressed for radiomics work were the differentiation of MS and diseases of the neuromyelitis optica spectrum [28] [29] [30] and the differentiation of MS patients from healthy control subjects. Studies based on deep learning also exist on the latter topic [31] [32] [33]. In this regard, Eitel et al. [34] also examined which characteristics the algorithm uses for classification and showed that in addition to typical lesions, areas that appear normal, such as the thalamus, can also contribute to a lesser extent to the algorithm's decision. Likewise, in other studies such as by Weygandt et al. [35] and Yoo et al. [31] healthy-appearing areas contributed to the predictive value of the algorithm. Hackmack et al., in an earlier study based on an SVM procedure [36], investigated the benefits of very complex and thus abstract features obtained by so-called wavelet transformations. These results impressively demonstrate that AI can make image data usable beyond the information that can be interpreted visually and radiologically. In another study, Hackmack et al. were able to show a correlation between the spatial information of MRI scans and symptom manifestation in MS patients [37]. The visual radiological evaluation of MS lesions, on the other hand, faces the so-called “clinical-radiological paradox”, namely the experience that lesion load and distribution, as recorded conventionally, does not allow any statement on disease severity.
Synthetic Image Generation
A more recent application of artificial intelligence is the generation of synthetic sequences that are predicted by neural networks using existing imaging [38]. Finck et al. used such an approach to generate a double inversion recovery (DIR) sequence from a FLAIR (FLuid Attenuated Inversion Recovery), a T2-weighted and a T1-weighted sequence [39]. DIR sequences show a particularly high lesion-to-parenchyma contrast and display cortical lesions better than conventional sequences [40] [41] [42]. Disadvantages of the DIR sequence are a high technical effort and a certain susceptibility to artifacts, thus it has not found its way into routine MRI protocols, with the exception of a few centers. Synthetic generation from standard sequences could bypass these disadvantages and thus help DIR sequences to become more widespread. In the aforementioned study, the synthetic sequence was found to be slightly behind the real acquired DIR sequence, but to represent MS lesions significantly better than the (real acquired) FLAIR sequence. In a variant of the Turing test, neuroradiologists were not able to distinguish between a real acquired and a synthetic DIR sequence [38]. [Fig. 3] presents an example of a synthetic DIR sequence.

Discussion and Outlook
The use of AI in MS is supported by several factors: MS is a common disease and people with MS receive regular MRI scans. For this reason, large numbers of MRI examinations are carried out, especially at specialty centers. However, a sufficient number of data sets is essential for to ensure effective machine learning. It is therefore not surprising that although there are a large number of studies for lesion diagnostics, none are available for the detection of relatively rare therapeutic complications such as PML (progressive multifocal leukoencephalopathy).
The provision of a large data set can significantly influence the development of artificial intelligence. Particularly prominent in this regard is the Alzheimer's Disease Neuroimaging Initiative (ADNI), the database of which supports numerous machine learning studies on degenerative diseases.
Of the above topics, lesion segmentation is the most intensively studied. The algorithms used here have matured considerably, and some are even CE-certified as commercial products or approved by the FDA. Thus, tools are available that in principle can now support routine radiological work. The results of these techniques can also be integrated into structured findings [43], so that a largely automated workflow for standardized analysis of MRI lesion load appears technically immediately accessible.
However, the prediction of clinical parameters is not yet as advanced. An important task for future computer algorithms would be the prediction of clinical progression of the disease. The above-mentioned studies on the prediction of conversion in CIS patients can be seen as a first step in this direction. The study by Hackmack et al. on better correlation of imaging and clinical manifestation shows a promising application potential made available by computer algorithms.
Starting therapy early is particularly important for MS [44] [45], therefore reliable early prediction of the expected course could influence therapy decisions. In view of an ever-increasing arsenal of available medications [46], it would also be particularly useful to know the extent machine learning can help to identify the most suitable therapy for individual patients. At the latest it seems increasingly unlikely that this task can be solved by algorithms solely based on imaging; instead, clinical data will increasingly have to be integrated into an algorithm as additional input parameters for such issues. When interpreting AI studies, it is particularly important that the quality of an algorithm depends largely on the learning cohort. Here clinical expertise is particularly necessary with regard to the quality of the labels. For example, several of the projects presented above still refer to the 2010 version of the McDonald criteria. However, if the updated version (2017) were to be used as a label, some patients previously diagnosed with CIS would already be considered definitively MS at baseline (especially due to the inclusion of CSF diagnostics). These algorithms can therefore not easily be used to predict according to the current McDonald criteria.
With the generation of DIR sequences, an example was presented of how synthetic imaging can be used to make efficient use of real acquired data. MRI protocols have some redundancy in the presentation of MS lesions in that lesions are usually presented in multiple sequences. Here it would be an important starting point to investigate what a “minimal” MRI protocol could look like, i. e. the smallest possible set of sequences from which other image contrasts could then be generated synthetically.
In recent years, the utility of contrast agents in MS imaging has been questioned with respect to maximizing the sensitivity of lesion detection [12] [47]. At the same time, discussion of intracranial gadolinium deposits [48] makes many patients increasingly skeptical about the use of contrast media. There are already some studies that have investigated the distinction between contrast-enhancing and non-enhancing lesions using other MRI parameters (e. g. diffusion imaging) [49]. In this context, it appears to be a particularly interesting goal to synthesize a T1-weighted sequence after contrast administration based on native imaging. One such study was recently presented by Kleesiek et al. for gliomas [50].
In summary, many application examples of AI in the processing of imaging data can be identified with respect to MS. There are solutions for segmentation tasks that are already available in everyday radiology. In addition to technical features, the focus is increasingly on practical aspects, including primarily the integration of appropriate software into existing IT infrastructures and access to the required computing capacity. In addition, since only commercial products can achieve certification for use in routine clinical practice, the question of how such programs are funded will have a significant impact on their actual dissemination.
Conflict of Interest
The authors declare that they have no conflict of interest.
-
References
- 1 Thompson AJ, Baranzini SE, Geurts J. et al. Multiple sclerosis. Lancet 2018; 391: 1622-1636
- 2 Thompson AJ, Banwell BL, Barkhof F. et al. Diagnosis of multiple sclerosis: 2017 revisions of the McDonald criteria. Lancet Neurol 2018; 17: 162-173
- 3 Kappos L, De Stefano N, Freedman MS. et al. Inclusion of brain volume loss in a revised measure of “no evidence of disease activity” (NEDA-4) in relapsing-remitting multiple sclerosis. Mult Scler 2016; 22: 1297-1305
- 4 Cortese R, Collorone S, Ciccarelli O. et al. Advances in brain imaging in multiple sclerosis. Ther Adv Neurol Disord 2019; 12
- 5 Lecun Y, Bengio Y, Hinton G. Deep learning. Nature 2015; 521: 436-444
- 6 Hosny A, Parmar C, Quackenbush J. et al. Artificial intelligence in radiology. Nat Rev Cancer 2018; 18: 500-510
- 7 Noble WS. What is a support vector machine?. Nat Biotechnol 2006; 24: 1565-1567
- 8 Breiman L. Random forests. Mach Learn 2001; 45: 5-32
- 9 Zaharchuk G, Gong E, Wintermark M. et al. Deep learning in neuroradiology. Am J Neuroradiol 2018; 39: 1776-1784
- 10 Moraal B, Meier DS, Poppe PA. et al. Subtraction MR images in a multiple sclerosis multicenter clinical trail setting. Radiology 2009; 250: 506-514
- 11 Eichinger P, Wiestler H, Zhang H. et al. A novel imaging technique for better detecting new lesions in multiple sclerosis. J Neurol 2017; 264: 1909-1918
- 12 Eichinger P, Schön S, Pongratz V. et al. Accuracy of unenhanced MRI in the detection of new brain lesions in multiple sclerosis. Radiology 2019; 291: 429-435
- 13 Eichinger P, Hock A, Schön S. et al. Acceleration of Double Inversion Recovery Sequences in Multiple Sclerosis with Compressed Sensing. Invest Radiol 2019; 54: 319-324
- 14 Schmidt P, Gaser C, Arsic M. et al. An automated tool for detection of FLAIR-hyperintense white-matter lesions in Multiple Sclerosis. Neuroimage 2012; 59: 3774-3783
- 15 Danelakis A, Theoharis T, Verganelakis DA. Survey of automated multiple sclerosis lesion segmentation techniques on magnetic resonance imaging. Comput Med Imaging Graph 2018; 70: 83-100
- 16 Li H, Jiang G, Zhang J. et al. Fully convolutional network ensembles for white matter hyperintensities segmentation in MR images. Neuroimage 2018; 183: 650-665
- 17 Ronneberger O, Fischer P, Brox T. U-net: Convolutional networks for biomedical image segmentation. In: Lecture Notes in Computer Science (including subseries Lecture Notes in Artificial Intelligence and Lecture Notes in Bioinformatics) 2015: 234-241
- 18 Gabr RE, Coronado I, Robinson M. et al Brain and lesion segmentation in multiple sclerosis using fully convolutional neural networks: A large-scale study. Mult Scler J 2019; [epub ahead of print]
- 19 Gillies RJ, Kinahan PE, Hricak H. Radiomics: Images are more than pictures, they are data. Radiology 2016; 278: 563-577
- 20 Miller DH, Chard DT, Ciccarelli O. Clinically isolated syndromes. Lancet Neurol 2012; 11: 157-169
- 21 Kuhle J, Disanto G, Dobson R. et al. Conversion from clinically isolated syndrome to multiple sclerosis: A large multicantre study. Mult Scler 2015; 21: 1013-1024
- 22 Comi G, Filippi M, Barkhof F. et al. Effect of early interferon treatment on conversion to definite multiple sclerosis: A randomised study. Lancet 2001; 357: 1576-1582
- 23 Comi G, Martinelli V, Rodegher M. et al. Effect of glatiramer acetate on conversion to clinically definite multiple sclerosis in patients with clinically isolated syndrome (PreCISe study): a randomised, double-blind, placebo-controlled trial. Lancet 2009; 374: 1503-1511
- 24 Zhang H, Alberts E, Pongratz V. et al. Predicting conversion from clinically isolated syndrome to multiple sclerosis–An imaging-based machine learning approach. NeuroImage Clin 2019; 21: 101593
- 25 Bendfeldt K, Taschler B, Gaetano L. et al. MRI-based prediction of conversion from clinically isolated syndrome to clinically definite multiple sclerosis using SVM and lesion geometry. Brain Imaging Behav 2019; 13: 1361-1374
- 26 Tallantyre EC, Brookes MJ, Dixon JE. et al. Demonstrating the perivascular distribution of ms lesions in vivo with 7-tesla MRI. Neurology 2008; 70: 2076-2078
- 27 Wottschel V, Chard DT, Enzinger C. et al. SVM recursive feature elimination analyses of structural brain MRI predicts near-term relapses in patients with clinically isolated syndromes suggestive of multiple sclerosis. NeuroImage Clin 2019; 24
- 28 Ma X, Zhang L, Huang D. et al. Quantitative radiomic biomarkers for discrimination between neuromyelitis optica spectrum disorder and multiple sclerosis. J Magn Reson Imaging 2019; 49: 1113-1121
- 29 Liu Y, Dong D, Zhang L. et al. Radiomics in multiple sclerosis and neuromyelitis optica spectrum disorder. Eur Radiol 2019; 29: 4670-4677
- 30 Eshaghi A, Wottschel V, Cortese R. et al. Gray matter MRI differentiates neuromyelitis optica from multiple sclerosis using random forest. Neurology 2016; 87: 2463-2470
- 31 Yoo Y, Tang LYW, Brosch T. et al. Deep learning of joint myelin and T1w MRI features in normal-appearing brain tissue to distinguish between multiple sclerosis patients and healthy controls. NeuroImage Clin 2018; 17: 169-178
- 32 Zhang YD, Pan C, Sun J. et al. Multiple sclerosis identification by convolutional neural network with dropout and parametric ReLU. J Comput Sci 2018; 28: 1-10
- 33 Wang SH, Tang C, Sun J. et al. Multiple sclerosis identification by 14-layer convolutional neural network with batch normalization, dropout, and stochastic pooling. Front Neurosci 2018; 12: 212
- 34 Eitel F, Soehler E, Bellmann-Strobl J. et al. Uncovering convolutional neural network decisions for diagnosing multiple sclerosis on conventional MRI using layer-wise relevance propagation. NeuroImage Clin 2019; 24
- 35 Weygandt M, Hackmack K, Pfüller C. et al. MRI pattern recognition in multiple sclerosis normal-appearing brain areas. PLoS One 2011; 6: e21138
- 36 Hackmack K, Paul F, Weygandt M. et al. Multi-scale classification of disease using structural MRI and wavelet transform. Neuroimage 2012; 62: 48-58
- 37 Hackmack K, Weygandt M, Wuerfel J. et al. Can we overcome the “clinico-radiological paradox” in multiple sclerosis?. J Neurol 2012; 259: 2151-2160
- 38 Li H, Paetzold JC, Sekuboyina A. et al. DiamondGAN: Unified Multi-modal Generative Adversarial Networks for MRI Sequences Synthesis. 2019: 795-803
- 39 Finck T, Li H, Grundl L. et al. Improving Multiple Sclerosis lesion detection with synthetic Double Inversion Recovery images. Invest Radiol 2020;
- 40 Geurts JJG, Pouwels PJW, Uitdehaag BMJ. et al. Intracortical lesions in multiple sclerosis: Improved detection with 3D double inversion-recovery MR imaging. Radiology 2005; 236: 254-260
- 41 Wattjes MP, Lutterbey GG, Gieseke J. et al. Double inversion recovery brain imaging at 3T: Diagnostic value in the detection of multiple sclerosis lesions. Am J Neuroradiol 2007; 28: 54-59
- 42 Seewann A, Kooi EJ, Roosendaal SD. et al. Postmortem verification of MS cortical lesion detection with 3D DIR. Neurology 2012; 78: 302-308
- 43 Pinto Dos Santos D, Hempel JM, Mildenberger P. et al. Structured Reporting in Clinical Routine. RoFo Fortschritte auf dem Gebiet der Rontgenstrahlen und der Bildgeb Verfahren 2019; 191: 33-39
- 44 Cerqueira JJ, Compston DAS, Geraldes R. et al. Time matters in multiple sclerosis: Can early treatment and long-term follow-up ensure everyone benefits from the latest advances in multiple sclerosis?. J Neurol Neurosurg Psychiatry 2018; 89: 844-850
- 45 Kavaliunas A, Manouchehrinia A, Stawiarz L. et al. Importance of early treatment initiation in the clinical course of multiple sclerosis. Mult Scler 2017; 23: 1233-1240
- 46 Tur C, Kalincik T, Oh J. et al. Head-to-head drug comparisons in multiple sclerosis: Urgent action needed. Neurology 2019; 93: 793-809
- 47 Aymerich Martínez F, Hlinkova J, Auger C. et al. Longitudinal study to measure iron deposit in basal ganglia and related structures in patients with clinically isolated syndrome. Mult Scler 2017; 23: 243-244
- 48 McDonald RJ, McDonald JS, Kallmes DF. et al. Intracranial gadolinium deposition after contrast-enhanced MR imaging. Radiology 2015; 275: 772-782
- 49 Gupta A, Al-Dasuqi K, Xia F. et al. The use of noncontrast quantitative MRI to detect gadolinium-enhancing multiple sclerosis brain lesions: A systematic review and meta-analysis. Am J Neuroradiol 2017; 38: 1317-1322
- 50 Kleesiek J, Morshuis JN, Isensee F. et al. Can Virtual Contrast Enhancement in Brain MRI Replace Gadolinium?: A Feasibility Study. Invest Radiol 2019; 54: 653-660
Correspondence
Publikationsverlauf
Eingereicht: 30. Dezember 2019
Angenommen: 17. April 2020
Artikel online veröffentlicht:
08. Juli 2020
© Georg Thieme Verlag KG
Stuttgart · New York
-
References
- 1 Thompson AJ, Baranzini SE, Geurts J. et al. Multiple sclerosis. Lancet 2018; 391: 1622-1636
- 2 Thompson AJ, Banwell BL, Barkhof F. et al. Diagnosis of multiple sclerosis: 2017 revisions of the McDonald criteria. Lancet Neurol 2018; 17: 162-173
- 3 Kappos L, De Stefano N, Freedman MS. et al. Inclusion of brain volume loss in a revised measure of “no evidence of disease activity” (NEDA-4) in relapsing-remitting multiple sclerosis. Mult Scler 2016; 22: 1297-1305
- 4 Cortese R, Collorone S, Ciccarelli O. et al. Advances in brain imaging in multiple sclerosis. Ther Adv Neurol Disord 2019; 12
- 5 Lecun Y, Bengio Y, Hinton G. Deep learning. Nature 2015; 521: 436-444
- 6 Hosny A, Parmar C, Quackenbush J. et al. Artificial intelligence in radiology. Nat Rev Cancer 2018; 18: 500-510
- 7 Noble WS. What is a support vector machine?. Nat Biotechnol 2006; 24: 1565-1567
- 8 Breiman L. Random forests. Mach Learn 2001; 45: 5-32
- 9 Zaharchuk G, Gong E, Wintermark M. et al. Deep learning in neuroradiology. Am J Neuroradiol 2018; 39: 1776-1784
- 10 Moraal B, Meier DS, Poppe PA. et al. Subtraction MR images in a multiple sclerosis multicenter clinical trail setting. Radiology 2009; 250: 506-514
- 11 Eichinger P, Wiestler H, Zhang H. et al. A novel imaging technique for better detecting new lesions in multiple sclerosis. J Neurol 2017; 264: 1909-1918
- 12 Eichinger P, Schön S, Pongratz V. et al. Accuracy of unenhanced MRI in the detection of new brain lesions in multiple sclerosis. Radiology 2019; 291: 429-435
- 13 Eichinger P, Hock A, Schön S. et al. Acceleration of Double Inversion Recovery Sequences in Multiple Sclerosis with Compressed Sensing. Invest Radiol 2019; 54: 319-324
- 14 Schmidt P, Gaser C, Arsic M. et al. An automated tool for detection of FLAIR-hyperintense white-matter lesions in Multiple Sclerosis. Neuroimage 2012; 59: 3774-3783
- 15 Danelakis A, Theoharis T, Verganelakis DA. Survey of automated multiple sclerosis lesion segmentation techniques on magnetic resonance imaging. Comput Med Imaging Graph 2018; 70: 83-100
- 16 Li H, Jiang G, Zhang J. et al. Fully convolutional network ensembles for white matter hyperintensities segmentation in MR images. Neuroimage 2018; 183: 650-665
- 17 Ronneberger O, Fischer P, Brox T. U-net: Convolutional networks for biomedical image segmentation. In: Lecture Notes in Computer Science (including subseries Lecture Notes in Artificial Intelligence and Lecture Notes in Bioinformatics) 2015: 234-241
- 18 Gabr RE, Coronado I, Robinson M. et al Brain and lesion segmentation in multiple sclerosis using fully convolutional neural networks: A large-scale study. Mult Scler J 2019; [epub ahead of print]
- 19 Gillies RJ, Kinahan PE, Hricak H. Radiomics: Images are more than pictures, they are data. Radiology 2016; 278: 563-577
- 20 Miller DH, Chard DT, Ciccarelli O. Clinically isolated syndromes. Lancet Neurol 2012; 11: 157-169
- 21 Kuhle J, Disanto G, Dobson R. et al. Conversion from clinically isolated syndrome to multiple sclerosis: A large multicantre study. Mult Scler 2015; 21: 1013-1024
- 22 Comi G, Filippi M, Barkhof F. et al. Effect of early interferon treatment on conversion to definite multiple sclerosis: A randomised study. Lancet 2001; 357: 1576-1582
- 23 Comi G, Martinelli V, Rodegher M. et al. Effect of glatiramer acetate on conversion to clinically definite multiple sclerosis in patients with clinically isolated syndrome (PreCISe study): a randomised, double-blind, placebo-controlled trial. Lancet 2009; 374: 1503-1511
- 24 Zhang H, Alberts E, Pongratz V. et al. Predicting conversion from clinically isolated syndrome to multiple sclerosis–An imaging-based machine learning approach. NeuroImage Clin 2019; 21: 101593
- 25 Bendfeldt K, Taschler B, Gaetano L. et al. MRI-based prediction of conversion from clinically isolated syndrome to clinically definite multiple sclerosis using SVM and lesion geometry. Brain Imaging Behav 2019; 13: 1361-1374
- 26 Tallantyre EC, Brookes MJ, Dixon JE. et al. Demonstrating the perivascular distribution of ms lesions in vivo with 7-tesla MRI. Neurology 2008; 70: 2076-2078
- 27 Wottschel V, Chard DT, Enzinger C. et al. SVM recursive feature elimination analyses of structural brain MRI predicts near-term relapses in patients with clinically isolated syndromes suggestive of multiple sclerosis. NeuroImage Clin 2019; 24
- 28 Ma X, Zhang L, Huang D. et al. Quantitative radiomic biomarkers for discrimination between neuromyelitis optica spectrum disorder and multiple sclerosis. J Magn Reson Imaging 2019; 49: 1113-1121
- 29 Liu Y, Dong D, Zhang L. et al. Radiomics in multiple sclerosis and neuromyelitis optica spectrum disorder. Eur Radiol 2019; 29: 4670-4677
- 30 Eshaghi A, Wottschel V, Cortese R. et al. Gray matter MRI differentiates neuromyelitis optica from multiple sclerosis using random forest. Neurology 2016; 87: 2463-2470
- 31 Yoo Y, Tang LYW, Brosch T. et al. Deep learning of joint myelin and T1w MRI features in normal-appearing brain tissue to distinguish between multiple sclerosis patients and healthy controls. NeuroImage Clin 2018; 17: 169-178
- 32 Zhang YD, Pan C, Sun J. et al. Multiple sclerosis identification by convolutional neural network with dropout and parametric ReLU. J Comput Sci 2018; 28: 1-10
- 33 Wang SH, Tang C, Sun J. et al. Multiple sclerosis identification by 14-layer convolutional neural network with batch normalization, dropout, and stochastic pooling. Front Neurosci 2018; 12: 212
- 34 Eitel F, Soehler E, Bellmann-Strobl J. et al. Uncovering convolutional neural network decisions for diagnosing multiple sclerosis on conventional MRI using layer-wise relevance propagation. NeuroImage Clin 2019; 24
- 35 Weygandt M, Hackmack K, Pfüller C. et al. MRI pattern recognition in multiple sclerosis normal-appearing brain areas. PLoS One 2011; 6: e21138
- 36 Hackmack K, Paul F, Weygandt M. et al. Multi-scale classification of disease using structural MRI and wavelet transform. Neuroimage 2012; 62: 48-58
- 37 Hackmack K, Weygandt M, Wuerfel J. et al. Can we overcome the “clinico-radiological paradox” in multiple sclerosis?. J Neurol 2012; 259: 2151-2160
- 38 Li H, Paetzold JC, Sekuboyina A. et al. DiamondGAN: Unified Multi-modal Generative Adversarial Networks for MRI Sequences Synthesis. 2019: 795-803
- 39 Finck T, Li H, Grundl L. et al. Improving Multiple Sclerosis lesion detection with synthetic Double Inversion Recovery images. Invest Radiol 2020;
- 40 Geurts JJG, Pouwels PJW, Uitdehaag BMJ. et al. Intracortical lesions in multiple sclerosis: Improved detection with 3D double inversion-recovery MR imaging. Radiology 2005; 236: 254-260
- 41 Wattjes MP, Lutterbey GG, Gieseke J. et al. Double inversion recovery brain imaging at 3T: Diagnostic value in the detection of multiple sclerosis lesions. Am J Neuroradiol 2007; 28: 54-59
- 42 Seewann A, Kooi EJ, Roosendaal SD. et al. Postmortem verification of MS cortical lesion detection with 3D DIR. Neurology 2012; 78: 302-308
- 43 Pinto Dos Santos D, Hempel JM, Mildenberger P. et al. Structured Reporting in Clinical Routine. RoFo Fortschritte auf dem Gebiet der Rontgenstrahlen und der Bildgeb Verfahren 2019; 191: 33-39
- 44 Cerqueira JJ, Compston DAS, Geraldes R. et al. Time matters in multiple sclerosis: Can early treatment and long-term follow-up ensure everyone benefits from the latest advances in multiple sclerosis?. J Neurol Neurosurg Psychiatry 2018; 89: 844-850
- 45 Kavaliunas A, Manouchehrinia A, Stawiarz L. et al. Importance of early treatment initiation in the clinical course of multiple sclerosis. Mult Scler 2017; 23: 1233-1240
- 46 Tur C, Kalincik T, Oh J. et al. Head-to-head drug comparisons in multiple sclerosis: Urgent action needed. Neurology 2019; 93: 793-809
- 47 Aymerich Martínez F, Hlinkova J, Auger C. et al. Longitudinal study to measure iron deposit in basal ganglia and related structures in patients with clinically isolated syndrome. Mult Scler 2017; 23: 243-244
- 48 McDonald RJ, McDonald JS, Kallmes DF. et al. Intracranial gadolinium deposition after contrast-enhanced MR imaging. Radiology 2015; 275: 772-782
- 49 Gupta A, Al-Dasuqi K, Xia F. et al. The use of noncontrast quantitative MRI to detect gadolinium-enhancing multiple sclerosis brain lesions: A systematic review and meta-analysis. Am J Neuroradiol 2017; 38: 1317-1322
- 50 Kleesiek J, Morshuis JN, Isensee F. et al. Can Virtual Contrast Enhancement in Brain MRI Replace Gadolinium?: A Feasibility Study. Invest Radiol 2019; 54: 653-660


