

Subscribe to RSS
DOI: 10.1055/a-2505-5657
Cortical Neurotransmitters Measured by Magnetic Resonance Spectroscopy Change Following Traumatic Brachial Plexus Injury
Authors
Funding R.G.W. is funded by the National Institute for Health Research (NIHR, DRF-2018-11-ST2-028 and CL-2021-02-002). S.P. is funded by a British Heart Foundation Chair (CH/16/2/32089). C.L-C. is funded by the Medical Research Council (MR/PO14445/1). This research is also supported by the University of Leeds Advanced Imaging Centre, which is funded by the Medical Research Council (MR/M008991/1) with support from the British Heart Foundation (BHF-SP/14/7/31351) and Arthritis Research UK (ARUK-21078). The views expressed are those of the author(s) and not necessarily those of the United Kingdom's National Health Service, NIHR or Department of Health.


Abstract
Introduction GABA (γ-aminobutyric acid) is the major inhibitory neurotransmitter in the brain. In response to injury within the central nervous system, GABA promotes cortical plasticity and represents a potential pharmacological target to improve functional recovery. However, it is unclear how GABA changes in the brain after traumatic brachial plexus injuries (tBPIs) which represents the rationale for this pilot study.
Methods We serially scanned seven males (mean age 42 years [SD 19] without head injury) up to 19 months after tBPIs. T1-weighted images (1-mm isotropic resolution) and J-edited spectra (MEscher–GArwood Point RESolved Spectroscopy [MEGA-PRESS], TE 68 ms, TR 2,000 ms, 2 cm isotropic voxels) were acquired using a MAGNETOM Prisma 3T (Siemens Healthcare, Erlangen, Germany). Data were analyzed in jMRUI blind to clinical information to quantify GABA, creatine plus phosphocreatine (Cr), and N-acetylaspartate (NAA) concentrations. Additionally, gray matter and white matter proportions were assessed using SPECTRIM software. Interhemispheric means were compared using linear methods. Confidence intervals (CIs) were generated to the 95% level.
Results Within weeks of injury, the hemisphere representing the injured upper limb had a significantly lower GABA:NAA ratio (mean difference 0.23 [CI 0.06–0.40]) and GABA:Cr ratio (mean difference 0.75 [CI 0.24–1.25]) than the uninjured side. There were no interhemispheric differences in NAA:Cr. By 12 months post-injury, interhemispheric differences in metabolite concentrations equalized. There was no difference in the proportion of gray matter, white matter, or cerebrospinal fluid between the injured and uninjured hemispheres.
Conclusion After brachial plexus injuries, there are interhemispheric differences in GABA concentrations within the sensory and motor cortex. This represents a potential pharmacological target that warrants further investigation.
Keywords
brachial plexus injury - spectroscopy - plasticity - motor - sensory - neurometabolites - GABA - NAAIntroduction
Cortical representations within the sensory and motor cortices have been shown to “remap” following learning[1] [2] [3] or after injury[4] over a time course of minutes to hours. The speed of cortical reorganization indicates that the mechanism underlying this phenomenon is likely to be via the “unmasking” of existing connections rather than synaptogenesis. Animal studies have demonstrated that a reduction in GABA (γ-aminobutyric acid), the brain's major inhibitory neurotransmitter, is crucial to this process.[5]
Following injury to the brain (e.g., traumatic brain injury,[6] transient ischemic attack,[7] and stroke[8]), GABA levels reduce in the sensory and motor cortices of the symptomatic hemisphere. Downregulation of GABA (reducing GABAergic inhibition) promotes plasticity analogous to long-term potentiation (LTP), allowing latent connections to strengthen and lost function to be recovered. In humans and animals, pharmacological modulation of GABA either prevents or facilitates LTP-like plasticity depending on the direction of modulation.[9] [10] For example, reducing GABAergic tone has been shown to promote plasticity and functional remapping in the motor cortex after stroke.[11] Consequently, GABA modulation represents a potential pharmacological target that may improve central plasticity following injury and therefore, functional recovery.
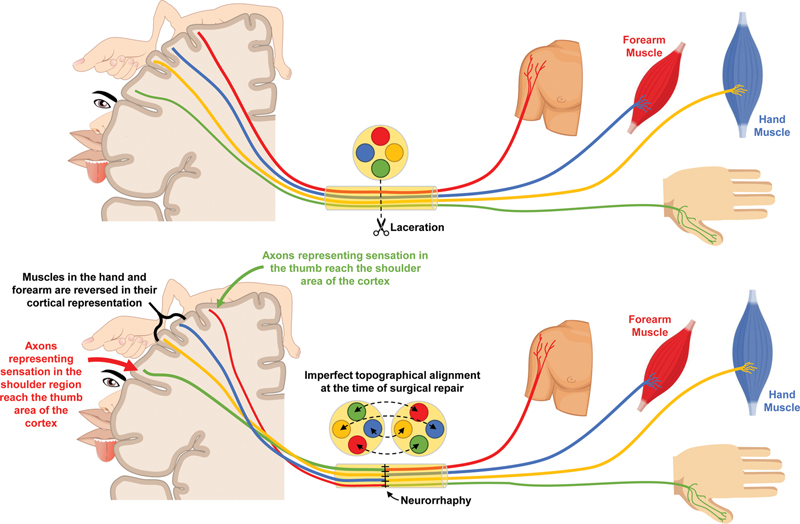
The brachial plexus is the network of nerves which innervate the upper limb. In England, there are approximately 20,000 cases of major trauma annually,[12] and 1% sustain traumatic injuries to their brachial plexus.[13] Traumatic brachial plexus injuries (tBPIs) are associated with disability,[14] [15] chronic pain,[16] psychological morbidity,[17] and reduced quality of life.[14] [15] These life-changing injuries have been estimated to directly cost health services in the United States $38,318 per patient[18] with an indirect cost of $1.1 million per patient.[19] Consequently, one in three patients with brachial plexus injuries (BPIs) are at risk of catastrophic health expenditure, whereby out-of-pocket health spending exceeds 40% of their post-subsistence income.[20] Surgical reconstruction of injured nerves is the mainstay of treatment; however, there are tens of thousands of axons in each nerve within the brachial plexus[21] and when surgically repaired, perfect topographical alignment is impossible. This means that regenerating motor neurons may synapse with different muscles and sensory neurons may innervate different cutaneous targets, necessitating cortical reorganization ([Fig. 1]). Alleviation of GABA-driven synaptic inhibition is essential to facilitate learning and plasticity mechanisms, but no studies have explored GABA modulation after peripheral nerve injury.
Measurement of neurometabolites in vivo in the brain is possible using proton (1H) magnetic resonance spectroscopy (1H-MRS). The most studied neurometabolites include glutamate, N-acetylaspartate (NAA), creatine plus phosphocreatine (Cr), and choline-containing compounds (Cho). Although GABA is present in the spectra, the relatively low concentration (1–2 mM[22]) and spectral overlap with other neurometabolites (e.g., creatine at 3 ppm)[23] [24] means that J-difference editing (as implemented in MEscher–GArwood Point RESolved Spectroscopy, MEGA-PRESS)[25] is necessary to separate the GABA signal contaminated by other molecules.
We aimed to quantify the concentrations of GABA, Cr, and NAA in the brain and explore how they change in adults with acute BPI, using 1H-MRS.
Methods
This cohort study was designed and reported in accordance with the STROBE and STARD guidance, taking into account the domains of the QUADAS-2[26] and PRISMA-DTA[27] tools. Approval was provided by the United Kingdom National Health Research Authority (ID 19/NW/0324) and conducted in accordance with the relevant guidelines and regulations. Written informed consent was obtained from all participants. The raw MRS data are available open-source at https://osf.io/un24g/.
Recruitment
Between January 2019 and July 2020, we screened 22 consecutive adults with acute tBPI admitted to three Major Trauma Centers within England. Fifteen were excluded for the following reasons: four declined to participate or were uncontactable, four required immediate surgery which precluded preoperative MRI, three were unable to meet COVID-related isolation requirements, two were claustrophobic, one had learning difficulties and so could not provide informed consent, and one patient had a cervical spine injury requiring extended immobilization in a collar.
Image Acquisition
Data were acquired at a field strength of 3 Tesla (T) using a MAGNETOM Prisma (Siemens Healthcare, Erlangen, Germany) with a 64-channel head coil. Firstly, we acquired a Magnetization Prepared RApid Gradient Echo (T1-weighted) dataset with the following parameters: TI 900 ms, TE 2.98 ms, TR 2,300 ms, flip angle 9 degrees, 176 sagittal slices, field of view 256 × 248, 1 mm isotropic resolution, GRAPPA factor 4, TrueForm B1 shim, no partial Fourier, AP phase encoding and bandwidth 240 Hz/Px. Thereafter, we acquired J-edited spectra using MEGA-PRESS[25] from 2-cm isotropic voxels centered on the right and left “hand knob” areas (using the “delta sign” on axial slices), respectively, with the following parameters: TE 68 ms, TR 2,000 ms, 64 averages, water suppression bandwidth 50 Hz, automated field map-based B0 shim, TrueForm B1 shim, 4 preparation scans, edit pulse frequency 1.9 ppm, edit pulse bandwidth 50 Hz, center frequency 4.7 ppm, receiver bandwidth 1,200 Hz for an acquisition time of 853 ms. Spectra were interleaved every acquisition between “edit-on” and “edit-off.” Real-time frequency adjustment was performed automatically on the scanner to prevent field drift affecting the difference spectra. The total scan time was 4 minutes 24 seconds per hemisphere. Data were stored as averaged fids for the “edit-on” and “edit-off” subspectra and exported from the scanner as .RDA files.
Spectroscopic Processing
After acquisition, a custom-made processing script was used to generate phase-corrected spectra for the “edit-on” and “edit-off” conditions as well as the edited (difference spectrum) itself. Anonymized data were imported into jMRUI[28] v5.2 (http://www.mrui.uab.es/mrui/) for analysis by S.R.W. and C.L-C., who were blind to clinical information. Prior to analysis using AMARES,[29] residual water was removed from the spectra using the HLSVD routine. The edited spectra were fitted with the following prior knowledge: NAA: relative phase 180 degrees, lorentzian line shape, frequency, linewidth and amplitude unconstrained; GABA: relative phase 0 degree Gaussian line shape, frequency and amplitude unconstrained, linewidth constrained between 15 and 25 Hz. Co-edited glutamate + glutamine: fitted as two peaks of equal amplitude separated by 10.25 Hz, relative phase 0 degree, lorentzian line shape, each linewidth constrained to equal that of NAA, frequency unconstrained. The prior knowledge for the edited GABA signal takes into account the contribution from co-edited macromolecules,[24] hence a gaussian line shape was assumed with constraints on the linewidth to force the fit to be meaningful. GABA measured from non-macromolecule-suppressed spectra is often referred to as GABA+, but we do not use this extra abbreviation for simplicity.
The “edit-off” spectra were also quantified by AMARES with the following prior knowledge for NAA, Cr at 3.03 and 3.96 ppm and cho: amplitudes and frequencies were all unconstrained, lorentzian line shape was stipulated and linewidths were all constrained to equal that of Cr at 3.03 ppm. Example spectra, together with the AMARE fit for an edited spectrum are shown in [Figs. 2] to [4]. To quantify GABA, Cr and NAA are assumed to be of quasi-constant concentration (both within and between subjects) such that GABA:Cr and GABA:NAA ratios may be computed as a proxy for GABA concentration. The edited signal for NAA was used to construct the GABA ratio, since any slight missetting or drift of the amplitude or phase of the pulse would affect both the edited GABA and NAA signals similarly.


The quality of the spectra was assessed by visual inspection and by measuring the linewidth and Cramer–Rao lower bound (CRLB) of the AMARES[29] fit for GABA in the edited spectra. The signal-to-noise ratio of NAA was also recorded for edited spectra.
Additionally, gray matter and white matter proportions were assessed using SPECTRIM.[30] This provides a graphical user interface to enable segmentation of the T1-weighted anatomical DICOM images, with extraction of the gray matter, white matter, and cerebrospinal fluid (CSF) content of the spectroscopic voxels. This is a necessary step to interpret any changes in GABA, as it is known that the GABA content of gray matter is approximately double that of white matter.[31]
Functional Outcomes Assessment
Grip strength was assessed using a digital grip dynamometer. Key (lateral) and tip (index pulp to thumb pulp) pinch were assessed using the Jamar Plus Digital Pinch Dynamometer For all assessments, three measurements were taken the best (strongest) was used.
Analysis
Data were analyzed using Stata v16/MP (StataCorp LLC, TX). Scaled variables approximating the normal distribution are represented by the mean (and standard deviation, SD). To estimate the interhemispheric differences in the concentrations of neurotransmitters, means were compared by linear regression. As the dataset is small, we used resampling with replacement (bootstrapping) with 1,000 iterations to improve estimates of the variance. Age may affect GABA levels[32] [33] but as there is no conceptual association between these variables and interhemispheric differences after nerve injury, adjustment was not required. Although the patients in this series were exposed to analgesics that modulate GABA and Glutamate (Gabapentin or Pregabalin), as we were directly comparing interhemispheric differences, the effect of these drugs will be neutralized, and so further adjustment is unnecessary. Confidence intervals (CIs) were generated to the 95% level.
Results
Ultimately, seven males were included with a mean age of 42 years (SD 19, range 21–76). No patients had a head injury. Given the severity of the injuries sustained by patients, the nationwide COVID-19 measures in place during the study, and the need to accommodate other surgeries, patients were scanned at different time points ([Table 1]) and there was variable attrition.
Abbreviation: RTC, road traffic collision; S, surgery; M, MRI.
Details of the injury and surgical reconstruction are shown also.
Patient Characteristics
Five adults were involved in vehicular collisions, one sustained a rugby “stinger” injury, and one sustained a traction injury from horse reigns. At the time of scanning, patients were consuming daily a mean of 1 g of paracetamol, 171 mg of NSAIDs, 24 mg of opioids (in morphine-equivalent units), and 21 mg of pregabalin. None received benzodiazepines or other neuromodulating agents.
Using the EQ-5D-5L, patients reported a median overall quality of life of 85% (interquartile range [IQR] 70–89). However, the summary scores were considerably lower for upper limb-specific tools, such as the impact of hand nerve disorders (I-HaND) (27%, IQR 11–46), Quick-disability of the arm, shoulder and hand (DASH) (42%, IQR 21–75), and brachial plexus assessment tool (BRaT) (62%, 7–84). The median visual analogue score for pain within the neck, arm, forearm, and hand were 20% (IQR 7.5–29), 9% (IQR 0–31), 21% (IQR 5–34), and 20% (IQR 4–36), respectively. Patients had worse motor deficits than sensory deficits, as shown in [Table 2] whereby strength in the injured limb was approximately half that of the normal limb, while the objective sensory tests, including the static two-point discrimination (median 2, IQR 2–4) and Semmes–Weinstein Monofilament (median 0.07, IQR 0.07–4) were within the normal range.
Abbreviation: CI, confidence interval; SD, standard deviation.
Magnetic Resonance Spectroscopy
Twenty spectra were collected from the seven subjects. [Figure 2] shows all 20 edited spectra aligned and overlaid. The spectra are reproducible and of very similar quality except for two traces which show increased (more negative) and decreased NAA signals. The statistical analyses were run both with and without these two spectra and no meaningful differences were noted with a sensitivity analysis excluding the two outlier datasets, so a complete case analysis is presented. Quality assurance metrics (NAA and edited GABA linewidth, CRLB, and signal-to-noise ratio, [Supplementary Table S1] [available in the online version only]) showing tight distributions of the parameters, consistent with the visual appearance of the overlaid spectra ([Figs. 2] [3] [4]). Both GABA linewidth and CRLB remain within three median absolute deviations of the median value, while NAA linewidth lies outside this range in two spectra. In these spectra, the linewidth is still well within expected values for the human brain at 3 T, so this does not justify the exclusion of the data. An example of the AMARES fit to an edited spectrum is shown in [Figs. 3] and [4] shows an example of an unedited (“edit-off”) spectra.
Those who had MRS within 3 months of their injury, the hemisphere representing the injured upper limb had a significantly lower GABA:NAA ratio as compared to the unaffected hemisphere (mean difference 0.23 [CI 0.06–0.40]). After approximately 6 months, the GABA:NAA difference had reduced to a mean of 0.14 (CI 0.03–0.25). Beyond a year, there was no detectable interhemispheric difference in GABA:NAA ([Fig. 5]).

A similar pattern was observed for GABA:Cr ratio, whereby patients who were scanned early (within 3 months of their injury) had significantly lower GABA:Cr ratios in the hemisphere representing the injured limb (mean difference 0.75 [CI 0.24–1.25]). At approximately 6 months, the interhemispheric difference in GABA:Cr had reduced (mean difference 0.26 [CI −0.14, 0.66]) and by 1 year, it had equalized ([Fig. 6]).

In contrast, we detected no significant interhemispheric differences in NAA:Cr at baseline or over time ([Fig. 7]). Equally, there were no differences in the proportion of gray matter, white matter, and CSF between the injured and uninjured hemispheres ([Fig. 8]). There were no appreciable linear associations between any neurotransmitter ratios and the I-HaND, EQ-5D-5L, Quick-DASH, or BrAT scores.


Discussion
We show prolonged reductions in GABA concentrations within the sensorimotor cortex representing the injured limb, in patients with acute tBPIs. This window of GABA reduction (facilitating improved plasticity and cortical remapping) appears to last for several months but not beyond 1 year, meaning that surgeons should aim for their reconstructive procedures to be completed as soon as possible, in the knowledge that reinnervation of target organs make take months and the plastic potential of the brain declines over time.
Recent work has shown that following traumatic brain injury,[6] transient ischemic attack,[7] stroke,[8] and ischemic deafferentation of the upper limb,[34] GABA concentrations fall in the symptomatic sensory and motor cortices. Levy et al (2002)[34] showed that GABA concentrations fall within minutes of ischemic deafferentation of human limbs. The understanding of temporal changes in GABA was extended by Yasen et al (2018)[6] in their study of mild traumatic brain injury, whereby cortical GABA concentrations were low at 3 days post-injury (compared to controls) and remained low 2 weeks later. Similar patterns were seen in patients with an established stroke (mean 7 months old) whereby patients had lower cortical GABA levels than controls.[8] In the longer term, Tremblay and colleagues (2014)[35] showed that (independent of cortical atrophy) GABA levels normalize 3 years after brain injury. These studies agree with our observations in tBPI, whereby GABA concentrations fall rapidly after injury, remain low months later and normalize approximately 1-year post-injury. It is important to clarify the temporal changes in GABAergic inhibition (whether active or incidental) because GABA levels are known to modulate plasticity. Lower levels of GABA have been shown to promote plasticity and improve perceptual learning.[36] By reducing GABAergic inhibition, vacant neuronal connections are “unmasked” which enables them to form new synapses within minutes-to-hours, such that function can be recovered or new connections fortified. Given the severity of BPI, its wider impact on both patients and their families, and the extraordinary costs to the health services, the potential to pharmacologically modulate GABA (to maintain and extend the window of “improved central plasticity” for surgical reconstruction) might benefit patients and surgeons alike.
In both animals[37] [38] and humans,[39] early nerve repair after BPI yields better outcomes. Recent work has shown that the time from injury to reconstruction in adults with BPI is linearly associated with functional outcomes, whereby each month of delay to neurotization reduces the odds of meaningful recovery by 7%.[39] Moreover, the choice of donor nerve(s) used for reconstruction directly influences the chance of useful recovery.[39] This observation cannot be completely explained by local anatomical factors (such as donor–recipient axon counts) and we speculate that the plastic potential of the cortex for some donor nerves may be greater than others. For example, the most prevalent donor nerves for restoring elbow flexion via neurotization of the musculocutaneous nerve are the Oberlin transfers[40] [41] (utilizing fascicles from the median and/or ulnar nerves that natively perform wrist flexion) or intercostal nerve transfer (using nerves that provide somatic control of breathing). Although the median/ulnar fascicles (with a mean of 1,318 and 1,860 axons[21]) and several intercostal nerves (with axon counts of 520–1,353 per nerve, depending on the level[42]) are well-matched for size and axon counts to the musculocutaneous nerve (which has 1,600 efferent axons producing elbow flexion[21]). there are systematic differences in the outcomes between these two transfers which implies that other factors are at play. In this paradigm, we hypothesize that the cortical areas controlling wrist flexion may be more amenable to adaption to controlling elbow flexion (after nerve transfer) than cortical areas designated for voluntary control of respiration. Whatever the mechanisms governing this change in cortical representation, the potential to modulate the plastic potential through GABA represents an important avenue for future research.
We were required to exclude some patients with more severe BPI or concurrent injuries. Equally, this population is difficult to access for research for many reasons: at best, patients are young, working-age adults with dependents and so have limited time to engage in research; at worst, they are polytraumatized, disabled,[14] [15] suffering from chronic pain,[16] and psychopathology[17] and so cannot engage. Consequently, our data collection time points were inconsistent which could introduce time-related biases and the sample we ultimately recruited may not reflect the population. It is widely known that GABA:NAA ratios are inhomogeneous in the brain[43] so our findings may not be generalizable to other regions. Within the sensorimotor cortex, the hemisphere responsible for the dominant hand exhibits higher GABA concentrations[44] so without controlling for this confound (due to insufficient data), our results may not be precise.
Conclusion
Our pilot data suggest that there may be a fading window of time (lasting approximately 12 months) where the brain has plastic potential and thus, is receptive to cortical reorganization following peripheral nerve repair. Future research should explore changes in GABA in other peripheral nerve disorders and whether modulation of GABA improves outcomes for patients.
Conflict of Interest
None declared.
-
References
- 1 Karni A, Meyer G, Jezzard P, Adams MM, Turner R, Ungerleider LG. Functional MRI evidence for adult motor cortex plasticity during motor skill learning. Nature 1995; 377 (6545) 155-158
- 2 Lea-Carnall CA, Trujillo-Barreto NJ, Montemurro MA, El-Deredy W, Parkes LM. Evidence for frequency-dependent cortical plasticity in the human brain. Proc Natl Acad Sci U S A 2017; 114 (33) 8871-8876
- 3 Vidyasagar R, Folger SE, Parkes LM. Re-wiring the brain: increased functional connectivity within primary somatosensory cortex following synchronous co-activation. Neuroimage 2014; 92 (100) 19-26
- 4 Schwenkreis P, Pleger B, Cornelius B. et al. Reorganization in the ipsilateral motor cortex of patients with lower limb amputation. Neurosci Lett 2003; 349 (03) 187-190
- 5 Jacobs KM, Donoghue JP. Reshaping the cortical motor map by unmasking latent intracortical connections. Science 1991; 251 (4996) 944-947
- 6 Yasen AL, Smith J, Christie AD. Glutamate and GABA concentrations following mild traumatic brain injury: a pilot study. J Neurophysiol 2018; 120 (03) 1318-1322
- 7 Figlewski K, Andersen H, Stærmose T, von Weitzel-Mudersbach P, Nielsen JF, Blicher JU. Decreased GABA levels in the symptomatic hemisphere in patients with transient ischemic attack. Heliyon 2018; 4 (09) e00790
- 8 Blicher JU, Near J, Næss-Schmidt E. et al. GABA levels are decreased after stroke and GABA changes during rehabilitation correlate with motor improvement. Neurorehabil Neural Repair 2015; 29 (03) 278-286
- 9 Castro-Alamancos MA, Donoghue JP, Connors BW. Different forms of synaptic plasticity in somatosensory and motor areas of the neocortex. J Neurosci 1995; 15 (7 Pt 2): 5324-5333
- 10 Trepel C, Racine RJ. GABAergic modulation of neocortical long-term potentiation in the freely moving rat. Synapse 2000; 35 (02) 120-128
- 11 Clarkson AN, Huang BS, Macisaac SE, Mody I, Carmichael ST. Reducing excessive GABA-mediated tonic inhibition promotes functional recovery after stroke. Nature 2010; 468 (7321) 305-309
- 12 Moran CG, Lecky F, Bouamra O. et al. Changing the system - major trauma patients and their outcomes in the NHS (England) 2008-17. EClinicalMedicine 2018; 2-3: 13-21
- 13 Midha R. Epidemiology of brachial plexus injuries in a multitrauma population. Neurosurgery 1997; 40 (06) 1182-1188 , discussion 1188–1189
- 14 Franzblau LE, Shauver MJ, Chung KC. Patient satisfaction and self-reported outcomes after complete brachial plexus avulsion injury. J Hand Surg Am 2014; 39 (05) 948-55.e4
- 15 Dolan RT, Butler JS, Murphy SM, Hynes D, Cronin KJ. Health-related quality of life and functional outcomes following nerve transfers for traumatic upper brachial plexus injuries. J Hand Surg Eur Vol 2012; 37 (07) 642-651
- 16 Teixeira MJ, da Paz Mda S, Bina MT. et al. Neuropathic pain after brachial plexus avulsion–central and peripheral mechanisms. BMC Neurol 2015; 15 (01) 73
- 17 Franzblau L, Chung KC. Psychosocial outcomes and coping after complete avulsion traumatic brachial plexus injury. Disabil Rehabil 2015; 37 (02) 135-143
- 18 Dy CJ, Lingampalli N, Peacock K, Olsen MA, Ray WZ, Brogan DM. Direct cost of surgically treated adult traumatic brachial plexus injuries. J Hand Surg Glob Online 2020; 2 (02) 77-79
- 19 Hong TS, Tian A, Sachar R, Ray WZ, Brogan DM, Dy CJ. Indirect cost of traumatic brachial plexus injuries in the United States. J Bone Joint Surg Am 2019; 101 (16) e80
- 20 Kay HF, Buss JL, Keller MR, Olsen MA, Brogan DM, Dy CJ. Catastrophic health care expenditure following brachial plexus injury. J Hand Surg Am 2023; 48 (04) 354-360
- 21 Gesslbauer B, Hruby LA, Roche AD, Farina D, Blumer R, Aszmann OC. Axonal components of nerves innervating the human arm. Ann Neurol 2017; 82 (03) 396-408
- 22 Govindaraju V, Young K, Maudsley AA. Proton NMR chemical shifts and coupling constants for brain metabolites. NMR Biomed 2000; 13 (03) 129-153
- 23 Rae CD. A guide to the metabolic pathways and function of metabolites observed in human brain 1H magnetic resonance spectra. Neurochem Res 2014; 39 (01) 1-36
- 24 Mullins PG, McGonigle DJ, O'Gorman RL. et al; Cardiff Symposium on MRS of GABA. Current practice in the use of MEGA-PRESS spectroscopy for the detection of GABA. Neuroimage 2014; 86: 43-52
- 25 Mescher M, Merkle H, Kirsch J, Garwood M, Gruetter R. Simultaneous in vivo spectral editing and water suppression. NMR Biomed 1998; 11 (06) 266-272
- 26 Whiting P, Rutjes AWS, Reitsma JB, Bossuyt PM, Kleijnen J. The development of QUADAS: a tool for the quality assessment of studies of diagnostic accuracy included in systematic reviews. BMC Med Res Methodol 2003; 3: 25
- 27 McGrath TA, Alabousi M, Skidmore B. et al. Recommendations for reporting of systematic reviews and meta-analyses of diagnostic test accuracy: a systematic review. Syst Rev 2017; 6 (01) 194
- 28 Stefan D, Cesare FD, Andrasescu A. et al. Quantitation of magnetic resonance spectroscopy signals: the jMRUI software package. Meas Sci Technol 2009; 20 (10) 104035
- 29 Mierisová S, van den Boogaart A, Tkác I, Van Hecke P, Vanhamme L, Liptaj T. New approach for quantitation of short echo time in vivo 1H MR spectra of brain using AMARES. NMR Biomed 1998; 11 (01) 32-39
- 30 Pedrosa de Barros N, McKinley R, Knecht U, Wiest R, Slotboom J. Automatic quality control in clinical (1)H MRSI of brain cancer. NMR Biomed 2016; 29 (05) 563-575
- 31 Mikkelsen M, Singh KD, Brealy JA, Linden DE, Evans CJ. Quantification of γ-aminobutyric acid (GABA) in 1H MRS volumes composed heterogeneously of grey and white matter. NMR Biomed 2016; 29 (11) 1644-1655
- 32 Gao F, Edden RAE, Li M. et al. Edited magnetic resonance spectroscopy detects an age-related decline in brain GABA levels. Neuroimage 2013; 78: 75-82
- 33 Aufhaus E, Weber-Fahr W, Sack M. et al. Absence of changes in GABA concentrations with age and gender in the human anterior cingulate cortex: a MEGA-PRESS study with symmetric editing pulse frequencies for macromolecule suppression. Magn Reson Med 2013; 69 (02) 317-320
- 34 Levy LM, Ziemann U, Chen R, Cohen LG. Rapid modulation of GABA in sensorimotor cortex induced by acute deafferentation. Ann Neurol 2002; 52 (06) 755-761
- 35 Tremblay S, Beaulé V, Proulx S. et al. Multimodal assessment of primary motor cortex integrity following sport concussion in asymptomatic athletes. Clin Neurophysiol 2014; 125 (07) 1371-1379
- 36 Lea-Carnall CA, Williams SR, Sanaei-Nezhad F. et al. GABA modulates frequency-dependent plasticity in humans. iScience 2020; 23 (11) 101657
- 37 Bourke G, McGrath AM, Wiberg M, Novikov LN. Effects of early nerve repair on experimental brachial plexus injury in neonatal rats. J Hand Surg Eur Vol 2018; 43 (03) 275-281
- 38 Jivan S, Kumar N, Wiberg M, Kay S. The influence of pre-surgical delay on functional outcome after reconstruction of brachial plexus injuries. J Plast Reconstr Aesthet Surg 2009; 62 (04) 472-479
- 39 Vernon Lee CY, Cochrane E, Chew M, Bains RD, Bourke G, Wade RG. The effectiveness of different nerve transfers in the restoration of elbow flexion in adults following brachial plexus injury: a systematic review and meta-analysis. J Hand Surg Am 2023; 48 (03) 236-244
- 40 Oberlin C, Béal D, Leechavengvongs S, Salon A, Dauge MC, Sarcy JJ. Nerve transfer to biceps muscle using a part of ulnar nerve for C5-C6 avulsion of the brachial plexus: anatomical study and report of four cases. J Hand Surg Am 1994; 19 (02) 232-237
- 41 Ray WZ, Pet MA, Yee A, Mackinnon SE. Double fascicular nerve transfer to the biceps and brachialis muscles after brachial plexus injury: clinical outcomes in a series of 29 cases. J Neurosurg 2011; 114 (06) 1520-1528
- 42 Schreiber JJ, Byun DJ, Khair MM, Rosenblatt L, Lee SK, Wolfe SW. Optimal axon counts for brachial plexus nerve transfers to restore elbow flexion. Plast Reconstr Surg 2015; 135 (01) 135e-141e
- 43 Durst CR, Michael N, Tustison NJ. et al. Noninvasive evaluation of the regional variations of GABA using magnetic resonance spectroscopy at 3 Tesla. Magn Reson Imaging 2015; 33 (05) 611-617
- 44 Oeltzschner G, Hoogenboom N, Baumgarten T. et al. Absolute GABA spectroscopy with MEGA-PRESS and watermapping in sensorimotor and visual cortex and correlation to handedness. Eur J Med Res 2014; 19 (S1): S28 , 2047–783X–19–S1–S28
Address for correspondence
Publication History
Received: 12 April 2024
Accepted: 18 December 2024
Article published online:
28 January 2025
© 2025. The Author(s). This is an open access article published by Thieme under the terms of the Creative Commons Attribution License, permitting unrestricted use, distribution, and reproduction so long as the original work is properly cited. (https://creativecommons.org/licenses/by/4.0/)
Georg Thieme Verlag KG
Oswald-Hesse-Straße 50, 70469 Stuttgart, Germany
-
References
- 1 Karni A, Meyer G, Jezzard P, Adams MM, Turner R, Ungerleider LG. Functional MRI evidence for adult motor cortex plasticity during motor skill learning. Nature 1995; 377 (6545) 155-158
- 2 Lea-Carnall CA, Trujillo-Barreto NJ, Montemurro MA, El-Deredy W, Parkes LM. Evidence for frequency-dependent cortical plasticity in the human brain. Proc Natl Acad Sci U S A 2017; 114 (33) 8871-8876
- 3 Vidyasagar R, Folger SE, Parkes LM. Re-wiring the brain: increased functional connectivity within primary somatosensory cortex following synchronous co-activation. Neuroimage 2014; 92 (100) 19-26
- 4 Schwenkreis P, Pleger B, Cornelius B. et al. Reorganization in the ipsilateral motor cortex of patients with lower limb amputation. Neurosci Lett 2003; 349 (03) 187-190
- 5 Jacobs KM, Donoghue JP. Reshaping the cortical motor map by unmasking latent intracortical connections. Science 1991; 251 (4996) 944-947
- 6 Yasen AL, Smith J, Christie AD. Glutamate and GABA concentrations following mild traumatic brain injury: a pilot study. J Neurophysiol 2018; 120 (03) 1318-1322
- 7 Figlewski K, Andersen H, Stærmose T, von Weitzel-Mudersbach P, Nielsen JF, Blicher JU. Decreased GABA levels in the symptomatic hemisphere in patients with transient ischemic attack. Heliyon 2018; 4 (09) e00790
- 8 Blicher JU, Near J, Næss-Schmidt E. et al. GABA levels are decreased after stroke and GABA changes during rehabilitation correlate with motor improvement. Neurorehabil Neural Repair 2015; 29 (03) 278-286
- 9 Castro-Alamancos MA, Donoghue JP, Connors BW. Different forms of synaptic plasticity in somatosensory and motor areas of the neocortex. J Neurosci 1995; 15 (7 Pt 2): 5324-5333
- 10 Trepel C, Racine RJ. GABAergic modulation of neocortical long-term potentiation in the freely moving rat. Synapse 2000; 35 (02) 120-128
- 11 Clarkson AN, Huang BS, Macisaac SE, Mody I, Carmichael ST. Reducing excessive GABA-mediated tonic inhibition promotes functional recovery after stroke. Nature 2010; 468 (7321) 305-309
- 12 Moran CG, Lecky F, Bouamra O. et al. Changing the system - major trauma patients and their outcomes in the NHS (England) 2008-17. EClinicalMedicine 2018; 2-3: 13-21
- 13 Midha R. Epidemiology of brachial plexus injuries in a multitrauma population. Neurosurgery 1997; 40 (06) 1182-1188 , discussion 1188–1189
- 14 Franzblau LE, Shauver MJ, Chung KC. Patient satisfaction and self-reported outcomes after complete brachial plexus avulsion injury. J Hand Surg Am 2014; 39 (05) 948-55.e4
- 15 Dolan RT, Butler JS, Murphy SM, Hynes D, Cronin KJ. Health-related quality of life and functional outcomes following nerve transfers for traumatic upper brachial plexus injuries. J Hand Surg Eur Vol 2012; 37 (07) 642-651
- 16 Teixeira MJ, da Paz Mda S, Bina MT. et al. Neuropathic pain after brachial plexus avulsion–central and peripheral mechanisms. BMC Neurol 2015; 15 (01) 73
- 17 Franzblau L, Chung KC. Psychosocial outcomes and coping after complete avulsion traumatic brachial plexus injury. Disabil Rehabil 2015; 37 (02) 135-143
- 18 Dy CJ, Lingampalli N, Peacock K, Olsen MA, Ray WZ, Brogan DM. Direct cost of surgically treated adult traumatic brachial plexus injuries. J Hand Surg Glob Online 2020; 2 (02) 77-79
- 19 Hong TS, Tian A, Sachar R, Ray WZ, Brogan DM, Dy CJ. Indirect cost of traumatic brachial plexus injuries in the United States. J Bone Joint Surg Am 2019; 101 (16) e80
- 20 Kay HF, Buss JL, Keller MR, Olsen MA, Brogan DM, Dy CJ. Catastrophic health care expenditure following brachial plexus injury. J Hand Surg Am 2023; 48 (04) 354-360
- 21 Gesslbauer B, Hruby LA, Roche AD, Farina D, Blumer R, Aszmann OC. Axonal components of nerves innervating the human arm. Ann Neurol 2017; 82 (03) 396-408
- 22 Govindaraju V, Young K, Maudsley AA. Proton NMR chemical shifts and coupling constants for brain metabolites. NMR Biomed 2000; 13 (03) 129-153
- 23 Rae CD. A guide to the metabolic pathways and function of metabolites observed in human brain 1H magnetic resonance spectra. Neurochem Res 2014; 39 (01) 1-36
- 24 Mullins PG, McGonigle DJ, O'Gorman RL. et al; Cardiff Symposium on MRS of GABA. Current practice in the use of MEGA-PRESS spectroscopy for the detection of GABA. Neuroimage 2014; 86: 43-52
- 25 Mescher M, Merkle H, Kirsch J, Garwood M, Gruetter R. Simultaneous in vivo spectral editing and water suppression. NMR Biomed 1998; 11 (06) 266-272
- 26 Whiting P, Rutjes AWS, Reitsma JB, Bossuyt PM, Kleijnen J. The development of QUADAS: a tool for the quality assessment of studies of diagnostic accuracy included in systematic reviews. BMC Med Res Methodol 2003; 3: 25
- 27 McGrath TA, Alabousi M, Skidmore B. et al. Recommendations for reporting of systematic reviews and meta-analyses of diagnostic test accuracy: a systematic review. Syst Rev 2017; 6 (01) 194
- 28 Stefan D, Cesare FD, Andrasescu A. et al. Quantitation of magnetic resonance spectroscopy signals: the jMRUI software package. Meas Sci Technol 2009; 20 (10) 104035
- 29 Mierisová S, van den Boogaart A, Tkác I, Van Hecke P, Vanhamme L, Liptaj T. New approach for quantitation of short echo time in vivo 1H MR spectra of brain using AMARES. NMR Biomed 1998; 11 (01) 32-39
- 30 Pedrosa de Barros N, McKinley R, Knecht U, Wiest R, Slotboom J. Automatic quality control in clinical (1)H MRSI of brain cancer. NMR Biomed 2016; 29 (05) 563-575
- 31 Mikkelsen M, Singh KD, Brealy JA, Linden DE, Evans CJ. Quantification of γ-aminobutyric acid (GABA) in 1H MRS volumes composed heterogeneously of grey and white matter. NMR Biomed 2016; 29 (11) 1644-1655
- 32 Gao F, Edden RAE, Li M. et al. Edited magnetic resonance spectroscopy detects an age-related decline in brain GABA levels. Neuroimage 2013; 78: 75-82
- 33 Aufhaus E, Weber-Fahr W, Sack M. et al. Absence of changes in GABA concentrations with age and gender in the human anterior cingulate cortex: a MEGA-PRESS study with symmetric editing pulse frequencies for macromolecule suppression. Magn Reson Med 2013; 69 (02) 317-320
- 34 Levy LM, Ziemann U, Chen R, Cohen LG. Rapid modulation of GABA in sensorimotor cortex induced by acute deafferentation. Ann Neurol 2002; 52 (06) 755-761
- 35 Tremblay S, Beaulé V, Proulx S. et al. Multimodal assessment of primary motor cortex integrity following sport concussion in asymptomatic athletes. Clin Neurophysiol 2014; 125 (07) 1371-1379
- 36 Lea-Carnall CA, Williams SR, Sanaei-Nezhad F. et al. GABA modulates frequency-dependent plasticity in humans. iScience 2020; 23 (11) 101657
- 37 Bourke G, McGrath AM, Wiberg M, Novikov LN. Effects of early nerve repair on experimental brachial plexus injury in neonatal rats. J Hand Surg Eur Vol 2018; 43 (03) 275-281
- 38 Jivan S, Kumar N, Wiberg M, Kay S. The influence of pre-surgical delay on functional outcome after reconstruction of brachial plexus injuries. J Plast Reconstr Aesthet Surg 2009; 62 (04) 472-479
- 39 Vernon Lee CY, Cochrane E, Chew M, Bains RD, Bourke G, Wade RG. The effectiveness of different nerve transfers in the restoration of elbow flexion in adults following brachial plexus injury: a systematic review and meta-analysis. J Hand Surg Am 2023; 48 (03) 236-244
- 40 Oberlin C, Béal D, Leechavengvongs S, Salon A, Dauge MC, Sarcy JJ. Nerve transfer to biceps muscle using a part of ulnar nerve for C5-C6 avulsion of the brachial plexus: anatomical study and report of four cases. J Hand Surg Am 1994; 19 (02) 232-237
- 41 Ray WZ, Pet MA, Yee A, Mackinnon SE. Double fascicular nerve transfer to the biceps and brachialis muscles after brachial plexus injury: clinical outcomes in a series of 29 cases. J Neurosurg 2011; 114 (06) 1520-1528
- 42 Schreiber JJ, Byun DJ, Khair MM, Rosenblatt L, Lee SK, Wolfe SW. Optimal axon counts for brachial plexus nerve transfers to restore elbow flexion. Plast Reconstr Surg 2015; 135 (01) 135e-141e
- 43 Durst CR, Michael N, Tustison NJ. et al. Noninvasive evaluation of the regional variations of GABA using magnetic resonance spectroscopy at 3 Tesla. Magn Reson Imaging 2015; 33 (05) 611-617
- 44 Oeltzschner G, Hoogenboom N, Baumgarten T. et al. Absolute GABA spectroscopy with MEGA-PRESS and watermapping in sensorimotor and visual cortex and correlation to handedness. Eur J Med Res 2014; 19 (S1): S28 , 2047–783X–19–S1–S28